2021 Analysis From Wayne

Good Day,
                   These are the Monthly/Weekly/Daily charts. Since NASDAQ, S&P500, and SOXX semiconductor indices are still bullish, S fund should continue bullish trend after a week consolidation.
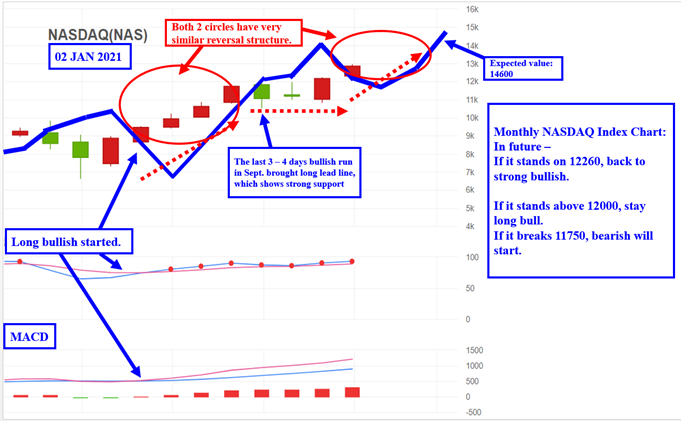
Above, the monthly reversal line shows the uptrend will continue to at least till next February/March time frame.
Both 2 red circles have very similar bullish structures.

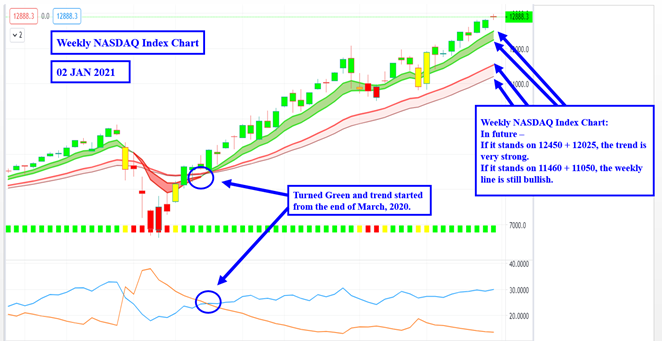
Above is the Weekly NASDAQ Index Chart:
In future –
If it stands on 12450 + 12025, the trend is very strong.

If it stands on 11460 + 11050, the weekly line is still bullish.


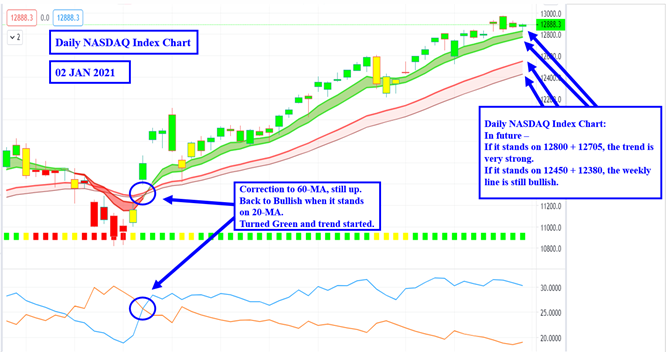
Above is the Daily NASDAQ Index Chart:
In future –
If it stands on 12800 + 12705, the trend is very strong.

If it stands on 12450 + 12380, the weekly line is still bullish.

Have a nice day, Wayne


  • 04/15/2024

    Good Day, You can read about anything you want to read about the current market. If you have a certain point of view you can find an article to assuage your feelings. It’s nice to feel good, but that kind of feel good doesn’t necessarily make you money. Just because you can find someone who…


  • 04/07/25

    Good Morning, I hate writing about things like this. Nobody really wants to hear it but it’s something that must be done. Are my message boards flooded? Oh yeah. You’ve got the combination of an unprecedented global event coupled with the fact that a lot of folks that are trading now never experienced a market…


  • 03/31/25

    Good Morning, Well where do I start? Someone asked me  if I was comfortable with my position in the market. I’m never comfortable when the market is volatile. It’s a difficult market to trade. If you watch it day my day then you’ll feel like your wrong about half the time. In the past when…