Good Evening, In recent weeks the market has begun to settle down a little bit. While that is good it still has quite a bit of damage to repair from the recent sell off. What are you talking about Scott? The S&P 500 is within a point of an all time record! Yes that is true but the major indices have become somewhat disconnected with what is going on with the average stock. If you don’t think so ask the investors holding tech stocks many of which are still off their highs by 30% or more. While it is true the market has moved higher it has done so with some brutal sector rotation. Here to date there has been no clear leader with leadership rotating from sector to sector. Recovery stocks such as airlines, hotels, and cruise ships have looked promising but overall have been inconsistent at best. Most recently small caps which led the way last year been lagging but overall they are still the place to be invested. I have fielded quite a few questions about our allocation lately as large caps which in our case would be the C Fund have out performed the mid and small cap stocks that make up the S Fund. While recently that has been true that has not been the case over the long run and we are invested for the long run. Fed Smith published an article today which broke down the performance of the TSP funds. I posted the article on our Facebook page but just in case you missed it you can click the link in the last sentence. Here is a little bit of what it had to say:
TSP Funds With Best Returns
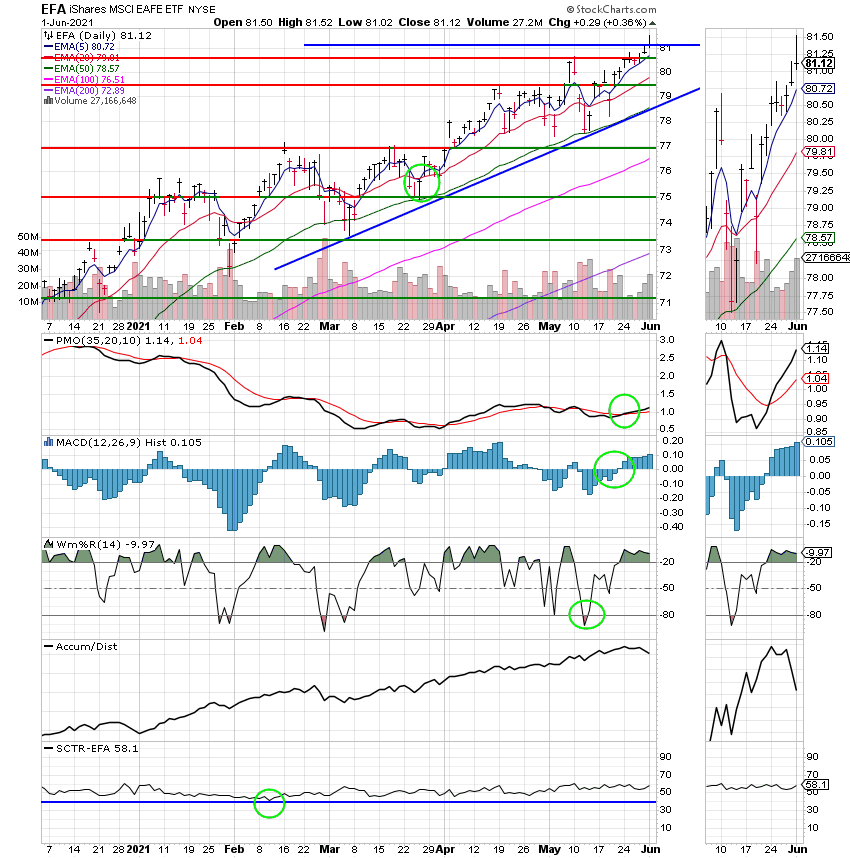
In a new twist, the I Fund had the best monthly return of any other fund in the Thrift Savings Plan (TSP). While the I Fund is still lagging behind the S and C Funds for the last few months and the year-to-date, those with investments in the I Fund will be glad to see a resurgence of this Fund in May.
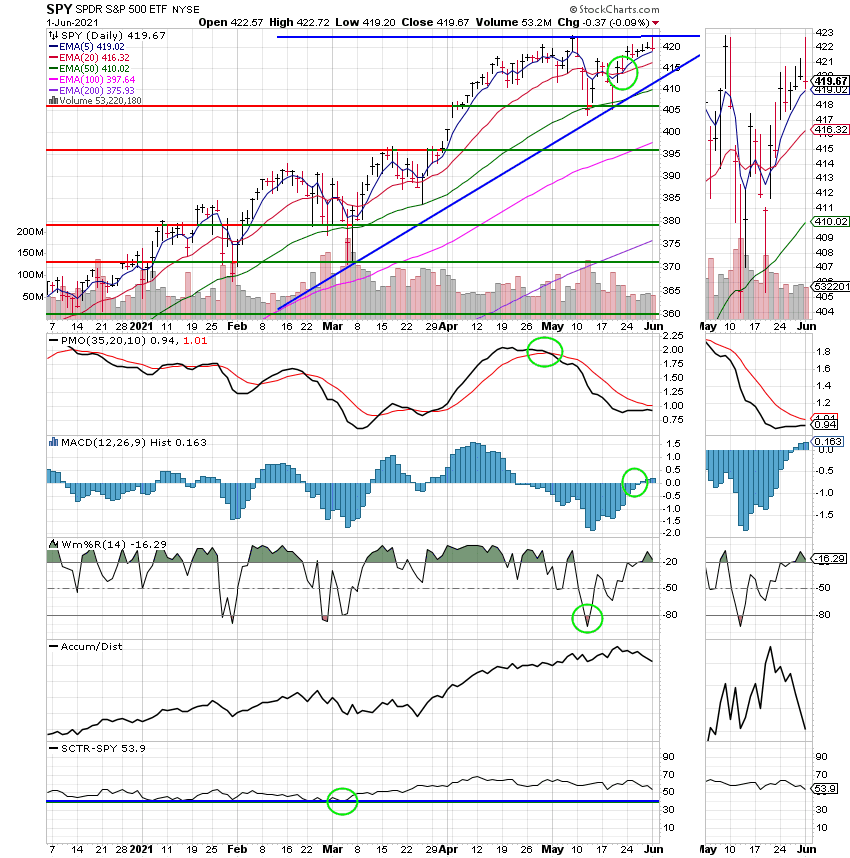
The S&P 500 went higher on the final trading day of the month. This was the fourth consecutive month of gains. Along with the index it follows, the C Fund edged up slightly for the month. The C Fund has also had a positive return for four straight months. It is also up 40.29% for the past 12 months and is up 12.61% so far in 2021.
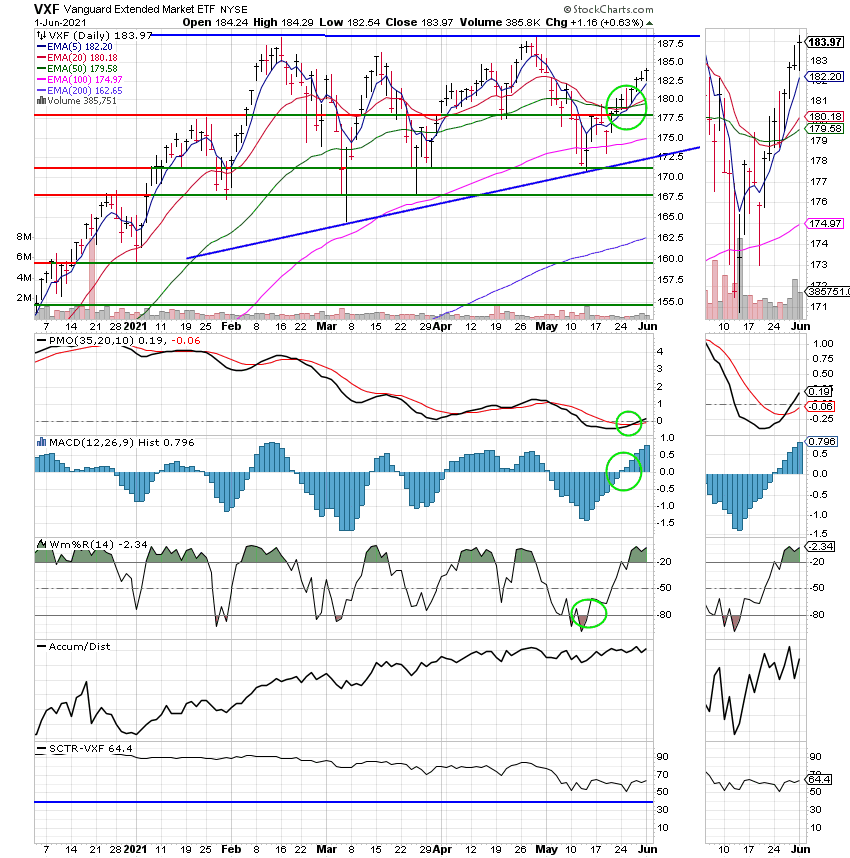
That puts the C Fund as the leader among TSP Funds for the year to date so far. The S Fund is a close second coming in at 11.60%. The S Fund is way ahead on a 12-month cycle though with a gain of 62.54%.
The I Fund is ahead for the month, as noted above and has a very respectable return of 39.15% for the past 12 months. It is up 10.58% so far in 2021.
OK, There you have it. Our chart for the S Fund has been the best for the past 12 months and these results show you why! Just because a chart is the best doesn’t mean that the stock or fund will be the best everyday. What it usually tells us is that it will be best over a period of time. Sure the C Fund has been good recently and a well timed move there would have increased your return. However, if you were a little early or a little late getting in or out that might not the case. The chart for the C Fund was indeed getting better and it almost overtook the S Fund as the best overall TSP chart, but it just never quite made it over the hill and until it does we will stay invested in the S. I’m sure there’s none of you that have a problem with making 62.54%? Yes the S Fund wasn’t the best every month but it was the best in enough months to outgain the C Fund by 22.25% in the past twelve months and right now it still has the strongest chart.
The days trading left us with the following results: Our TSP allotment posted a gain of +0.63%. For comparison, the Dow gained +0.13%, the Nasdaq slipped -0.09%, and the S&P 500 was off slightly at -0.05%. Praise the Lord we had another nice day!
Stocks End Mixed on Worries of Tighter Federal Reserve Policy
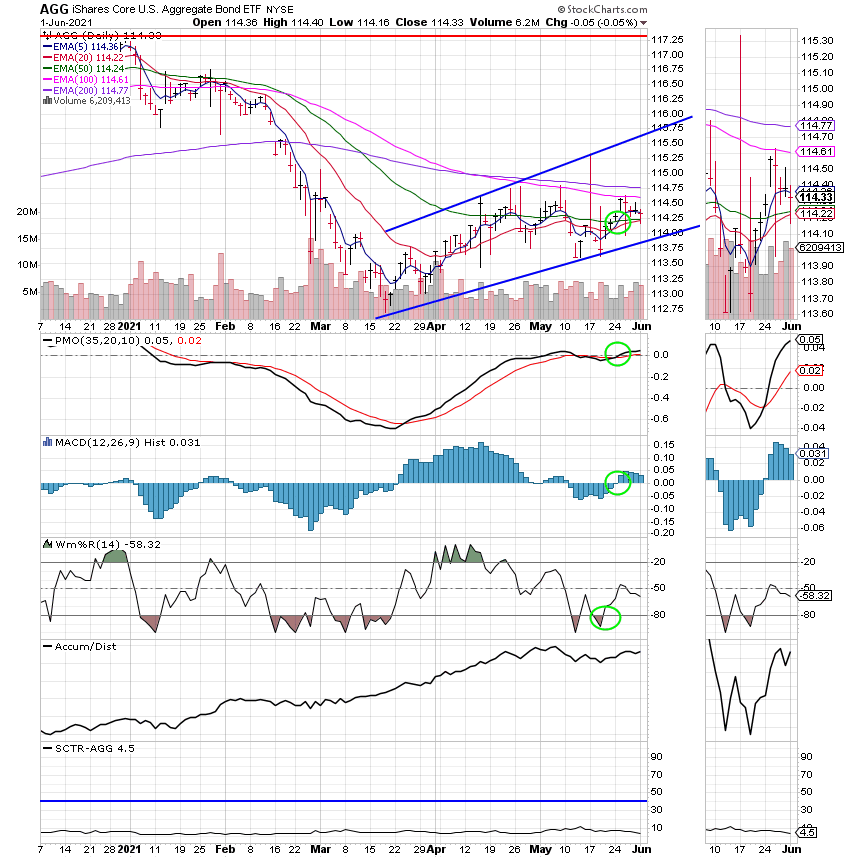
The days action left us with the following signals: C-Buy, S-Buy, I-Buy, F-Hold. We are currently invested at 100/S. Our allocation is now +11.60% for the year not including the days results. Here are the latest posted results.
| 05/31/21 | Prior Prices | ||||
| Fund | G Fund | F Fund | C Fund | S Fund | I Fund |
| Price | 16.5953 | 20.7261 | 62.9628 | 82.8114 | 39.1342 |
| $ Change | 0.0000 | 0.0000 | 0.0000 | 0.0000 | 0.0000 |
| % Change day | +0.00% | +0.00% | +0.00% | +0.00% | +0.00% |
| % Change week | +0.00% | +0.00% | +0.00% | +0.00% | +0.00% |
| % Change month | +0.00% | +0.00% | +0.00% | +0.00% | +0.00% |
| % Change year | +0.53% | -2.22% | +12.61% | +11.60% | +10.58% |
| Fund | L INC | L 2025 | L 2030 | L 2035 | L 2040 |
| Price | 22.9191 | 11.7861 | 41.5177 | 12.4607 | 47.1246 |
| $ Change | 0.0000 | 0.0000 | 0.0000 | 0.0000 | 0.0000 |
| % Change day | +0.00% | +0.00% | +0.00% | +0.00% | +0.00% |
| % Change week | +0.00% | +0.00% | +0.00% | +0.00% | +0.00% |
| % Change month | +0.00% | +0.00% | +0.00% | +0.00% | +0.00% |
| % Change year | +2.88% | +5.61% | +7.07% | +7.71% | +8.36% |
| Fund | L 2045 | L 2050 | L 2055 | L 2060 | L 2065 |
| Price | 12.904 | 28.2566 | 13.8639 | 13.8638 | 13.8637 |
| $ Change | 0.0000 | 0.0000 | 0.0000 | 0.0000 | 0.0000 |
| % Change day | +0.00% | +0.00% | +0.00% | +0.00% | +0.00% |
| % Change week | +0.00% | +0.00% | +0.00% | +0.00% | +0.00% |
| % Change month | +0.00% | +0.00% | +0.00% | +0.00% | +0.00% |
| % Change year | +8.91% | +9.49% | +11.70% | +11.70% | +11.69% |