Good Afternoon, Wow, I just spent almost two hours going over charts with a broker friend of mine and I’m about shot. I hate to use the word brain dead but that’s about where I’m at. There are a lot of folks out there that recognize the benefits of technical analysis but who are boomers and not really comfortable using computers. I run into a lot of these folks and it really takes a bunch of time and effort just to get them to be able to operate and understand the most basic charting systems. It takes a good while for them to even understand the lingo. For instance what is the wick of a candle or the body of a candle? What is a positive or negative divergence? Etc. Etc. In other words try telling someone what these things are over the phone. Try describing how to operate an indicator and select Simple moving average, Exponential moving average or Weighted moving average and what they actually are. It’s kind of like speaking in two different languages! It might as well be French and English! There’s a lesson to be learned from everything and for this it is don’t wait until the last minute to try to understand technical analysis. Go to stockcharts.com or whatever website you want to use and start to learn the basics. So at least you will understand what you are reading about and be able to interpret a basic chart. Then maybe somewhere along the way you will save both of us some time……and a headache. Could you pass the Tylenol please…… Seriously, it’s never too late to learn a new skill.
Alright, this market continues to be frustrating. Should I talk about how we are overdue for a pullback like everyone else. After all, that is a fact! I don’t think we will talk about that, at least not today. We’re going to run our system and make the same decisions anyway. So what difference does it really make?? It is what it is! So….what’s causing all these issues anyway? Market expectations, that’s what. We started the current journey back in the pandemic when the expectation was that the Fed would increase stimulus. The market was already addicted to cheap money since the financial crisis and expected more given those difficult conditions. Then the expectations shifted to when will they decrease the stimulus. Then it moved onto expectations that the economy would go into a recession as the stimulus ended. Then came the reality that all this cheap money actually had a price and that was higher inflation. So the new expectation was that the Fed would increase interest rates to control inflation. When would they do it and by how much? Surely that would push the market into the recession we were expecting, when would it begin. Higher interest rates and inverted yield curves and all that time the market was having withdrawal symptoms as it lost it’s quick fix of cheap money. So the Fed increased rates and those expectations came to a crescendo when at last they topped out which brings us to where we are now. The market has realized that the economy is too strong for a recession and that the Fed may have in fact actually engineered a goldilocks soft landing for the economy. No recession. Now the current focus of investors is when will the Fed start decreasing rates or how long will interest rates remain elevated before they start to decrease. As I mentioned weekly for the last two and one half years it all starts and ends at a two percent rate of inflation. That is the Feds target and that effects every decision that they are making right now. Every one! The expectations have now shifted from when will they start cutting to how many cuts will they have. You see it’s all about prognostication as if that will change what anyone does in the end. I think they’re all getting the horse before the cart. Why not wait until we get the first rate cut before we worry about how many we will have in 2024 and 2025. Every piece of news is run through the ‘how many cuts will we have in 2024’ filter. Last week (Okay, a little prognostication) I went over why I didn’t think the Fed will cut rates in June which is the current expectation of anybody and everybody. Can you imagine the disappointment if I’m correct? So lets go over this. Market expectations have gone from rate cuts starting in March with up to six cuts in 2024 to rates cuts starting in June with four cuts in 2024, to three in 2024, to maybe just one cut in 2024… As I said last week, the Fed is data dependent. What incentive do they have to decrease rates when the economy is still strong (unaffected by the current higher rates) and inflation remains stubbornly above their two percent target rate. Shoot, right now we’re lucky they stopped increasing rates!! They have zero and I mean zero incentive to decrease rates at this time. If they increase rates right now they risk reigniting inflation. Does anybody remember the late 70’s? Alright then, Scott, when will the market finally return to normal? What is normal anymore? When do I think it will have longer runs with lower volatility? Do you really have to ask?? I hear them now, “Here he goes again”. When the the rate of inflation returns to two percent. All I can say is that if you’ve been reading this blog and you don’t know that by now then I can’t help you. For now, more of the same. Yes the forecast is for cloudy skies and a likely pullback. Don’t worry about when. Just get out when you see it on your charts. Another day in the office. Keep praying! God will guide your hand.
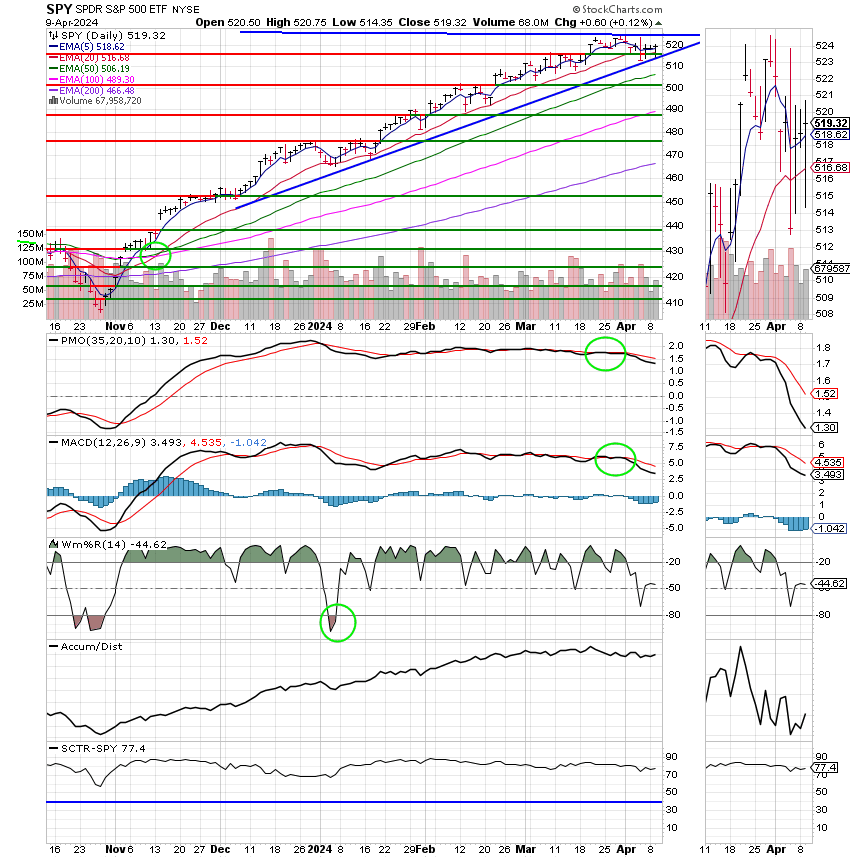
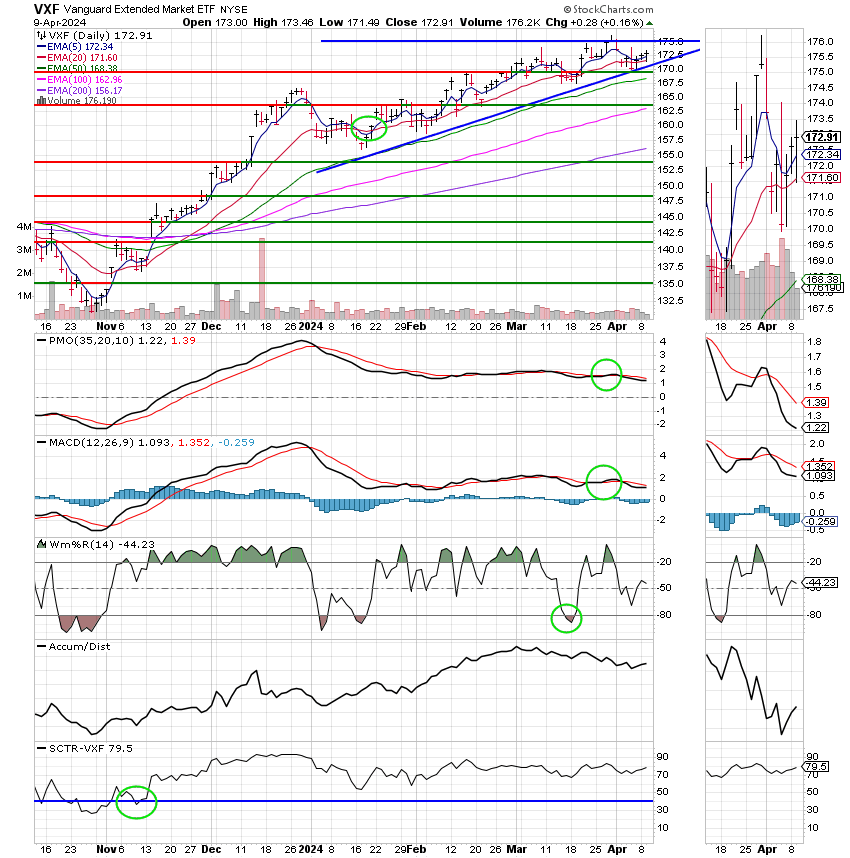
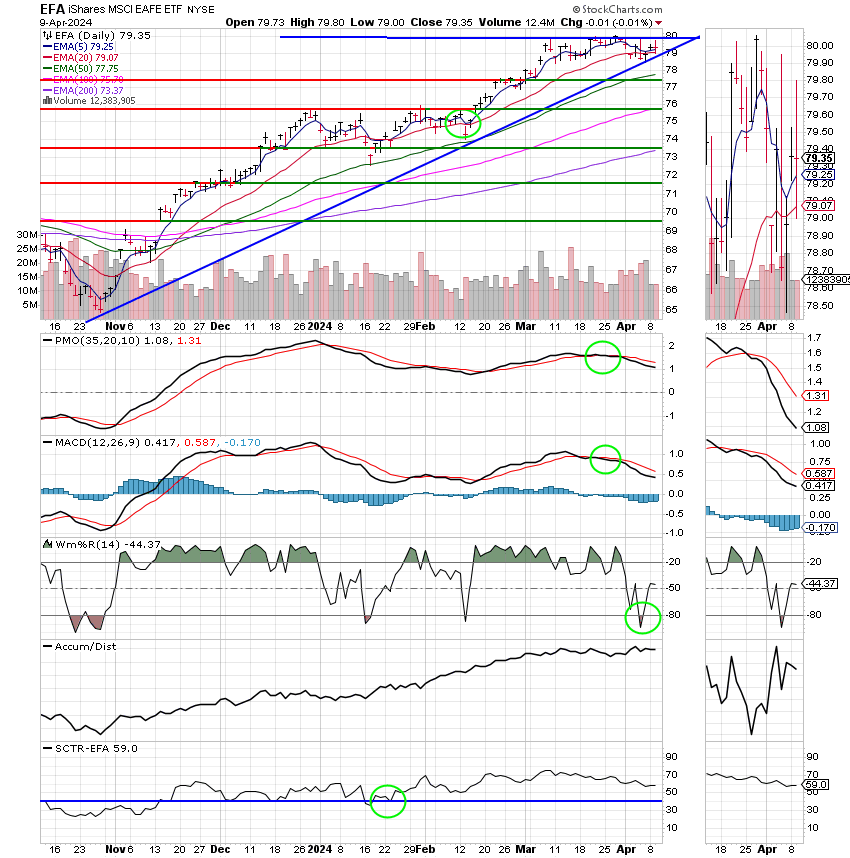
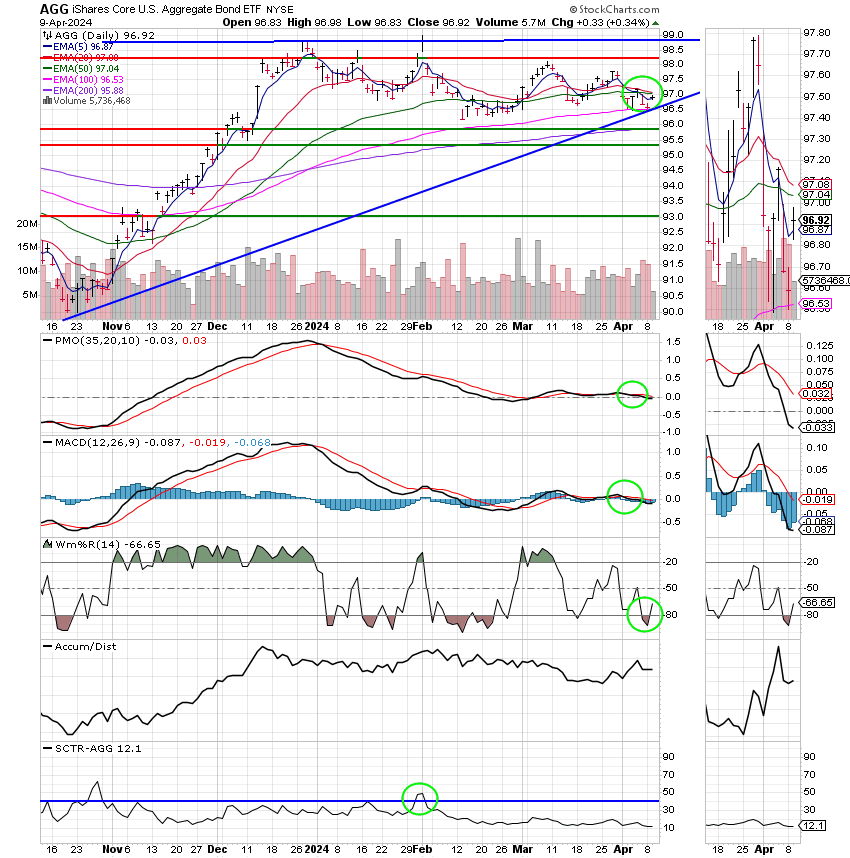
The days trading left us with the following results: Our TSP allotment posted a modest gain of +0.14%. For comparison, the Dow was flat at -0.02%, the Nasdaq was up +0.32%, and the S&P 500 added +0.14%. For those of you keeping score the S fund was higher at +0.16% and the I fund was flat at -0.01%.
Dow closes little changed on Tuesday as Wall Street braces for key U.S. inflation report: Live updates
The days action left us with the following signals: C-Hold, S-Hold, I-Hold, F-Sell. We are currently invested at 100/C. Our allocation is now +3,83% for the year not including the days results:
| 04/08/24 | Prior Prices | ||||
| Fund | G Fund | F Fund | C Fund | S Fund | I Fund |
| Price | 18.1691 | 18.8723 | 81.4147 | 81.117 | 42.3494 |
| $ Change | 0.0065 | -0.0179 | -0.0291 | 0.3891 | 0.2085 |
| % Change day | +0.04% | -0.09% | -0.04% | +0.48% | +0.49% |
| % Change week | +0.04% | -0.09% | -0.04% | +0.48% | +0.49% |
| % Change month | +0.09% | -1.09% | -0.97% | -1.59% | -0.53% |
| % Change year | +1.15% | -1.82% | +9.48% | +5.22% | +5.40% |


