
-For Your Reference- April 27th, 2026
I move in 100% S fund (Small & Mid Caps)
Vix is 20.70
Fear & Greed Index: 67
Fear & Greed Index: 67

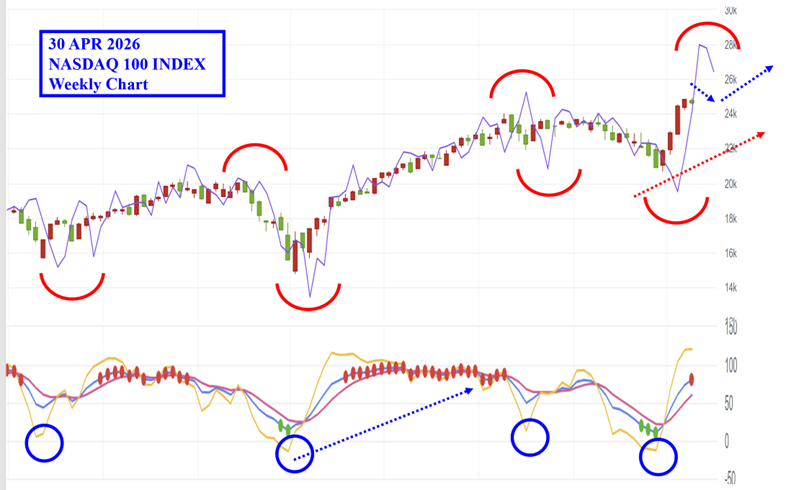
From a market sentiment perspective, I primarily utilize the Fear & Greed Index, Put/Call Ratio, and VIX to cross-reference and identify extreme sentiment conditions, in order to locate potential bottoming areas characterized by indicator resonance. When these three indicators simultaneously signal a contraction in fear alongside a recovery, it often suggests that the market has completed its emotional reset and is entering a phase of capital reallocation. This serves as a key basis for my identification of the current reversal area.


From a technical structure standpoint, I apply the Low-3-Pivot to define potential reversal areas, and further validate these signals through a multi-timeframe analysis across the monthly and weekly charts. Based on current observations, as long as key support levels remain intact, the broader trend retains its continuity, with the potential to extend upward for approximately three to four months. In addition, no negative divergences are observed across the monthly, weekly, and daily timeframes, indicating that medium- to long-term momentum remains healthy. The only sign of overheating appears on the 60-minute timeframe, suggesting that a short-term pullback is needed to reset momentum before continuation to the upside.
More importantly, the weekly MACD has just formed a golden cross, which is typically interpreted as the initiation of a medium-term trend. Therefore, short-term volatility or pullbacks should not be overinterpreted as a trend reversal, but rather understood as normal fluctuations within an ongoing uptrend. The overall directional bias remains bullish.

From a fundamental and structural perspective, the market continues to be supported by the strong growth dynamics of the AI sector, and remains firmly within the primary uptrend phase. Whether viewed through the lens of industry expansion, trend persistence, or capital rotation dominated by growth equities, there is no clear indication that the market has entered a recessionary phase. Meanwhile, the AI value chain is expanding beyond core semiconductors and compute power into downstream segments such as advanced packaging, thermal management, and PCBs. This broadening participation is leading to industry-wide resonance and revenue validation, further reinforcing the durability and certainty of long-term growth.
Therefore, the primary risk at this stage is not a market collapse, but rather missing the broader trend due to emotional reactions during periods of volatility and pullbacks.
The typical market cycle often unfolds as:
“Significant drop → bottom formation → bounce→ breakout”
Within such a structure, short-term fluctuations should not be used to invalidate the long-term trend. Ultimately, the key question is not whether one should be long, but whether one has the discipline and conviction to hold long positions through volatility.
In the daily chart above:
JJ indicator is in blue.
MACD (12,26,9) with EMA above the centerline 0-axis.
BBS(9) is in green.
J 21 is above the centerline 0-axis.
Guandin indicator is in the green.
BD4 shows entry signal
BD9 shows entry signal
Stch MTM crossed up
Stch MTM crossed up
For TSP TIPS, the current recommended allocation is:
100 % S fund (Small & Mid Caps)
-For Your Reference- April 30th, 2026
Vix is 20.30
Fear & Greed Index: 60.3
Fear & Greed Index: 60.3
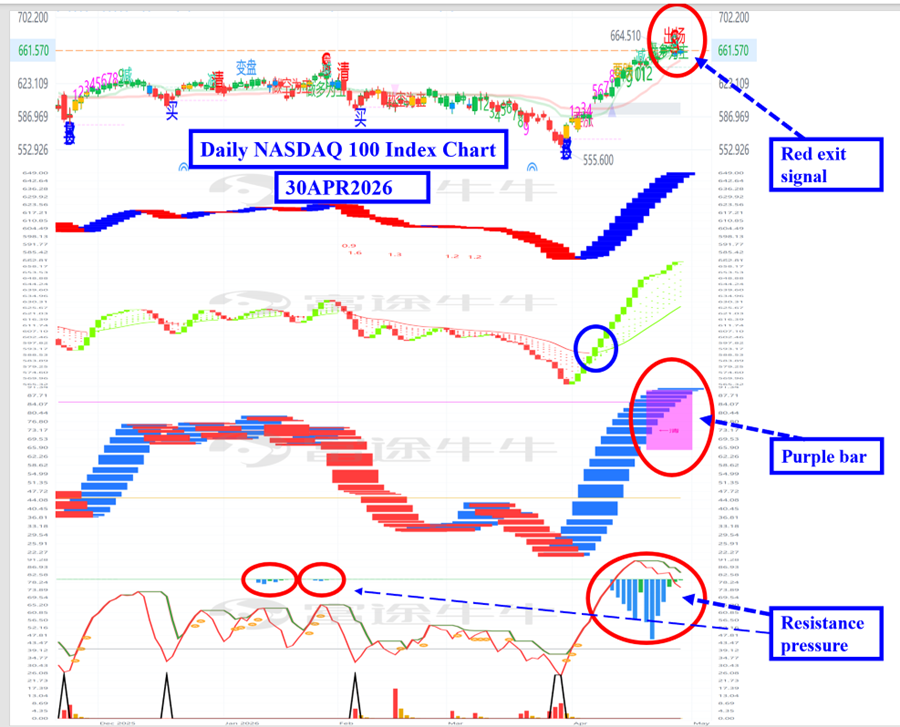
Following the massive rally in early April driven by the “Low-3 Pivot”, the Federal Reserve’s resolution on April 29, 2026, established a “neutral-to-hawkish” tone.
The FOMC meeting on April 29 did not signal any upcoming rate cuts, creating implicit pressure on the high-valuation indexes. Sustained high interest rates mean that corporations must now prove their AI investments can generate tangible profits; otherwise, indexes with high bias ratio(extreme deviation from moving averages) may face a pullback.
The “Wash-Out” and “High-3 Pivot” Due to the previous rally creating excessive positive bias ratio and WM%, the most prudent strategy at this point is a temporary exit to G. This is not a bearish outlook on the long-term market, but rather a strategic move to increase cash and avoid the upcoming “High-3 Pivot” pressure period on the weekly charts next week. If key support levels are breached, we may expect a 1-to-2 week “wash-out” (Sideways & consolidation), which will actually clear the path and create entry points for the anticipated gains in May.
For sectors such as Memory, CPO (Co-Packaged Optics), and PCB, entering the market only after sell-the-news risks being “trapped” by institutional sellers. At this stage, investors should refuse to chase highs. The fundamental trend of the “AI Commercialization Year” remains unchanged. Following this correction, the primary bullish wave in May is expected to be even stronger.
“Opportunity follows the wash-out; risk follows the rally.” The volatility in late April and early May 2026 is a necessary component of a healthy market.
On the daily charts, the “Purple Bar” signal indicates an elevated risk of a pullback. This signal will only “repaint” (disappear) if resistance is decisively broken out. As the Purple Bar remains visible, the risk of a pullback persists. However, if choose to remain stay in C and S, that is also a viable option, as the mid-to-long-term outlook remains bullish.
In the daily chart above:
JJ indicator is in blue.
MACD (12,26,9) with EMA above the centerline 0-axis.
BBS(9) is in green.
J 21 is above the centerline 0-axis.
Guandin indicator is in the green.
BD4 shows entry signal
BD9 shows entry signal
Stch MTM crossed up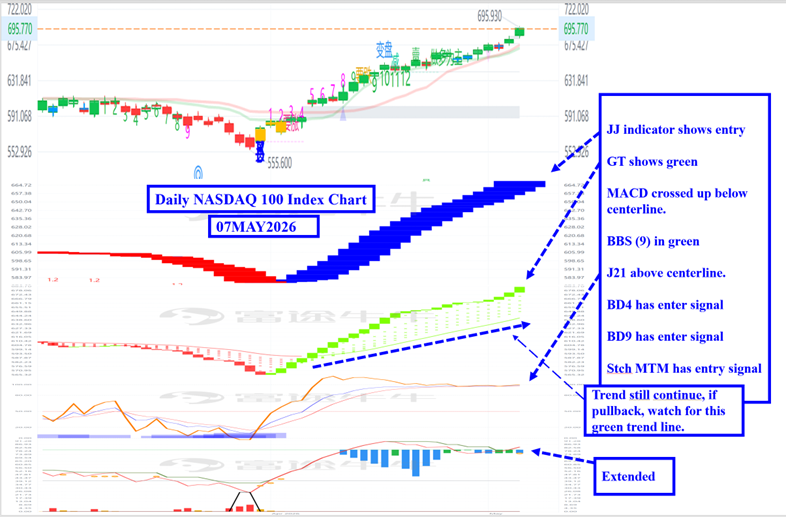
The current strategy:
100 % S fund (VXF)
Stch MTM crossed up
-For Your Reference- May 7th, 2026
I move in 100% S fund (VXF)
Vix is 19.15
Fear & Greed Index: 68
Fear & Greed Index: 68
So far, the U.S. indexes remains in a mid-cycle bullish structure. However, it has transitioned from an early-stage “AI-driven single-leadership rally” into a “multi-sector rotation + higher volatility mature phase.” Supported by continued strength in AI capital expenditures and upward revisions in corporate earnings, the overall trend remains bullish.
Core conclusion:
The U.S. indexes is still in a bull trend, but it has entered a mid-stage characterized by “trend continuation + accelerating sector rotation + rising volatility,” rather than a one-directional early-stage rally. The trend remains upward, but the indexes has clearly shifted into a phase where sector rotation and capital flow dynamics matter more than index-level direction.
The U.S. indexes is still in a bull trend, but it has entered a mid-stage characterized by “trend continuation + accelerating sector rotation + rising volatility,” rather than a one-directional early-stage rally. The trend remains upward, but the indexes has clearly shifted into a phase where sector rotation and capital flow dynamics matter more than index-level direction.
From a technical perspective, there is no negative divergence on the weekly and monthly charts. On the daily chart, the breakout above resistance levels had invalidated prior exit signals and effectively “repainted” the trend structure.
Because the overall trend remains upward, I decide to stay in S fund with the highest SCTR score.
The current strategy:
As long as the JJ and GT trend lines remains intact, positions will be reduced or exited when it breaks. When price reclaims and re-enters the trend line, positions will be re-established. This approach is used to capture trend-following gains while managing downside risk.
I have used this method before, and it has helped me capture index momentum effectively and successfully. There is no need for concern, as the process is disciplined and systematic.
In the daily chart above:
JJ indicator is in blue.
MACD (12,26,9) with EMA above the centerline 0-axis.
BBS(9) is in green.
J 21 is above the centerline 0-axis.
Guandin indicator is in the green.
BD4 shows entry signal
BD9 shows entry signal
Stch MTM crossed up
Stch MTM crossed up
For TSP TIPS, the current recommended allocation is:
100 % S fund (VXF)
May God bless..
PS:
please give will to: www.stjude.org/donatetoday
please give will to: www.stjude.org/donatetoday
No-kill animal shelter: http://www.camanoanimalshelter.com
Sebring Angels: www.sebringangels.com
Dr. Dolittle Rescue Ranch:
Remember that this is only a recommendation. Please feel free to alter it in any way that you feel comfortable with and by all means if what your doing is working great for you, then keep on doing it!
Leave a Reply
You must be logged in to post a comment.