Good Evening,
The Dow and S&P managed a third straight day of gains. Although they weren’t spectacular, they were enough to push the S&P 500 to another new record. However, it was the underlying action that made the day interesting. Energy stocks continued to rebound strongly, which powered the market as a whole. Those fortunate enough to be invested in the energy sector today made some gaudy gains. Our AMP allocation enjoyed a little of that action and posted a strong gain of +0.89%! That easily bested the Dow, S&P, and Nasdaq on the day. Our TSP allocation (which is mired in G Fund due to TSP trading restrictions) held steady. Today, the difference between protecting your capital in TSP and outside of TSP was close to +0.9%!!!
Rev Shark (James DePorre) at www.sharkinvesting.com had some interesting comments today about 2014. Here is what he had to say:
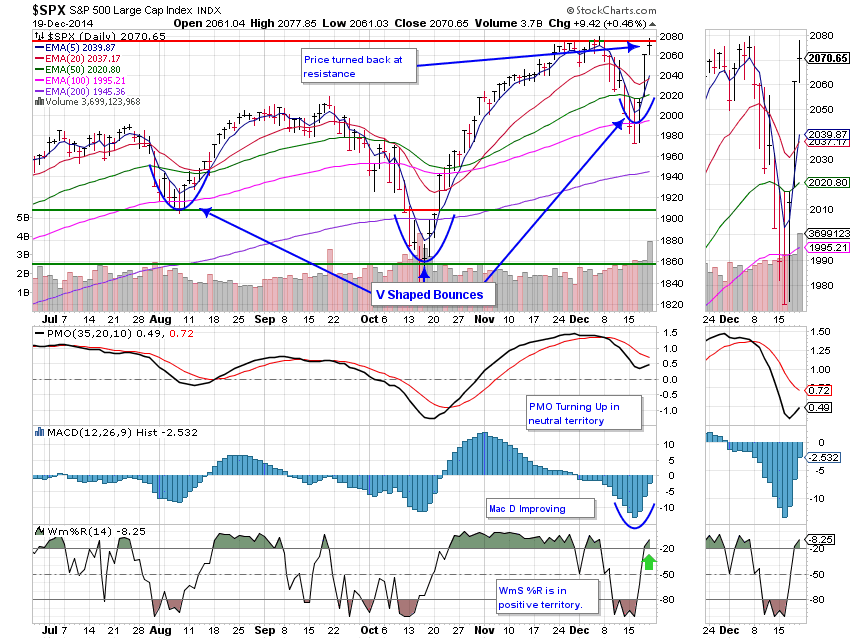
It isn’t too surprising that we have seen another V-shaped move in this market after the oil-driven breakdown. What is surprising is that the bounce was so vicious and that oil didn’t come back much at all.
Market players are so used to these V-shaped recovers that they are making them bigger and faster as they try to stay in front of them. The more you try to anticipate the bounce the earlier and the more aggressive you buy. That is what has happened over the last couple days as market players were quite confident that the market would produce another quick, straight up bounce. The fact that we are in the best time of the year seasonally helped to add fuel to the fire.
So now what? Can the indices build on a move of over 4.5% in two days? Yes they can. This is the seventh time the S&P500 has had back to back 2% moves when it was over the 200 day simple moving average. The index was higher five days later six out of seven times with an average gain of 2.36% according to paststat.com.
The bad news about this statistic is that the last time we had this happen was in April 2000 which marked the top of the Nasdaq bubble. The bears will be focused on that fact but for those who traded back then this market feels nothing at all like it did at that time. The mood now isn’t nearly as euphoric. In fact the moves elicited a high level of disgust once again as many market players were left on the sidelines and couldn’t keep up.
A good example of how this market action has caught people by surprise is Investors Business’s Daily which is the bible of momentum players. Its market timing indicator went to ‘market in correction’ a few days ago and still has it there after the huge move. The timing system used by IBD requires technical follow through days and this action simply bypasses that requirement. The theory is that markets that breakdown don’t go straight back up but that has not been the case in this market for a long time. If you didn’t buy the breakdown you had a hard time getting back in.
There really is no question that this market action has left a huge number of people behind. One common comment yesterday was that it was a complete waste of time trying to pick individual stocks because the only way to keep up was to buy leveraged index ETFs. Many market players are convinced that the market is now driven much more by indices than by the underlying stock. A few years ago that wasn’t possible but now the focus on index vehicles makes it the prime moving force in the market.
He hit the nail on the proverbial head…. by the way that paststat.com is a great web site.
Wall Street up for third day, led by energy shares
The day’s action left us with the following signals: C-Neutral, S-Neutral, I-Sell, F-Buy. We are invested at 100/G and will be make any changes until the new year. Our allocation is now -3.33% on the year not including today’s results. Here are the latest posted results:
| 12/18/14 | |||||
| Fund | G Fund | F Fund | C Fund | S Fund | I Fund |
| Price | 14.6061 | 16.7382 | 27.1816 | 35.9458 | 24.5082 |
| $ Change | 0.0008 | -0.0208 | 0.6420 | 0.6121 | 0.5962 |
| % Change day | +0.01% | -0.12% | +2.42% | +1.73% | +2.49% |
| % Change week | +0.03% | -0.39% | +2.97% | +3.05% | +1.69% |
| % Change month | +0.11% | -0.17% | -0.19% | +0.02% | -2.98% |
| % Change year | +2.23% | +6.33% | +13.85% | +6.76% | -4.13% |
| L INC | L 2020 | L 2030 | L 2040 | L 2050 | |
| Price | 17.4435 | 22.9127 | 24.8266 | 26.4004 | 14.9773 |
| $ Change | 0.0815 | 0.2706 | 0.3723 | 0.4508 | 0.2890 |
| % Change day | +0.47% | +1.20% | +1.52% | +1.74% | +1.97% |
| % Change week | +0.54% | +1.34% | +1.72% | +1.98% | +2.23% |
| % Change month | -0.08% | -0.44% | -0.59% | -0.68% | -0.82% |
| % Change year | +3.73% | +5.12% | +5.83% | +6.31% | +6.50% |