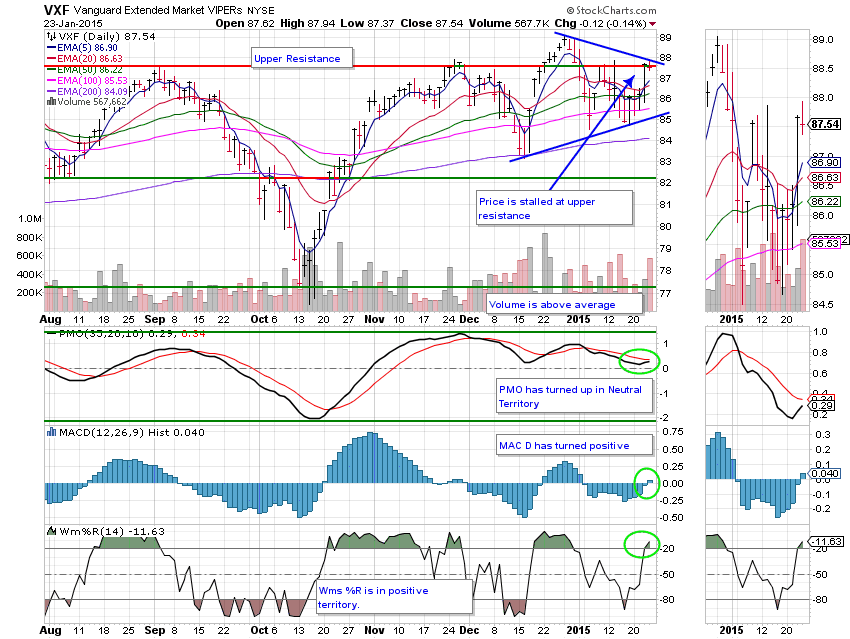
Good Evening,
The media reported that UPS put a damper on the party today with a sour outlook in their report. It could be said that the negative action throws up a red flag (given the past 16 months) of nothing but v-shaped recoveries. I don’t necessarily agree with that point of view. I and a few other old guys can remember trading prior to the FED induced perma-rally, when there was usually some back filling after a big run. Yesterday’s rally was a big one. Since the financial crisis of 2008-2009, the market would suddenly turn back up after a dip and give little- if any- chance to re-enter the market. The only thing they know is that you have to stay in it to win it. When it doesn’t go straight up, they just don’t know what to think. This market is indeed extended and could/will turn down hard at some point. However, the current trend is up and in a normal pre-fed uptrend. There is almost always backing and filling after a big run. That is what we mean when we talk about a good entry point. Normal markets don’t just head straight up! What has taken placed since 2009 is not normal! There are some analysts that have put forth the theory that it is the new normal, but some of us old guys keep thinking that it will return (at least partially) to the old days. I say partially because I know that algorithm trading can run the market up pretty fast. Nevertheless, I still believe that there are enough people keying their own trades that things can slow down a little.
So what am I babbling about? I think today was just some good old fashioned consolidation before another leg up. The trend is still up. Above all things, you must respect the trend. If we are indeed returning to old fashioned trading, this is a good entry point. In a normal market, the rule is that in a bull market you buy weakness and in a bear market you sell strength. The current charts are bull market charts. Until they change, the latter rule applies: you buy weakness. Problem is a lot of people have gotten used to the endless straight up action with little weakness, forcing experienced traders to ‘chase’ sticks higher or sit out and miss the run altogether. That’s the reason that only 15% of Fund managers performed as well as the major benchmarks in 2015. Think about it, they are the professionals. This didn’t happen by accident.
Let me submit a new scenario to you. Think now, just think… Who will be lagging in performance if the market continues to trade in a more normal manner? You will know when the time comes to get out of the market. You will know when a bear market arrives. That’s the reason we have charts. Could the current action signal a change in the market character? Could the v-shaped bounces be history? Yes, indeed, it sure could. It’s either that or a new down trend. Unless I caught the perfect top with this newsletter, my charts say (at least in the short term) that there’s more upside.
Today’s back filling left us with the following results. Our TSP allotment slipped back -0.2794% and AMP was off -0.1501%. Both allocations hung on to a lion’s share of yesterday’s gains. For comparison, the Dow dropped -0.79%, the NASDAQ was up +0.16%, and the S&P 500 lost -0.55%. All in all, our allocations did well on the day.
Wall Street falls on miners, UPS; indexes up for week
| 01/22/15 | |||||
| Fund | G Fund | F Fund | C Fund | S Fund | I Fund |
| Price | 14.6352 | 16.9957 | 27.2464 | 36.2781 | 24.4679 |
| $ Change | 0.0008 | -0.0151 | 0.4099 | 0.6451 | 0.0233 |
| % Change day | +0.01% | -0.09% | +1.53% | +1.81% | +0.10% |
| % Change week | +0.03% | -0.18% | +2.18% | +1.81% | +1.28% |
| % Change month | +0.13% | +1.15% | +0.30% | -0.05% | +1.03% |
| % Change year | +0.13% | +1.15% | +0.30% | -0.05% | +1.03% |
| L INC | L 2020 | L 2030 | L 2040 | L 2050 | |
| Price | 17.4972 | 22.9853 | 24.9107 | 26.4943 | 15.0268 |
| $ Change | 0.0423 | 0.1324 | 0.1876 | 0.2342 | 0.1478 |
| % Change day | +0.24% | +0.58% | +0.76% | +0.89% | +0.99% |
| % Change week | +0.40% | +0.95% | +1.21% | +1.39% | +1.57% |
| % Change month | +0.27% | +0.38% | +0.42% | +0.44% | +0.46% |
| % Change year | +0.27% | +0.38% | +0.42% | +0.44% | +0.46 |

