
Good Evening,
The recent pattern of slow starts with dips being bought continued today as the market was heading down early but reversed and managed to close modestly higher on the day. Of course, the big news on the day was that the Nasdaq hit a new all time high eclipsing the old one that was set in March of 2000. There was a lot of talk out there about the market collapse the last time the Nasdaq hit this level. It was devastating for many folks when that bubble popped as the lost a great percentage of their portfolios, but the market today is a horse of different colors. Stock valuations are much more reasonable than they were back then and the level of excitement is not the same. If anything, it could be said that there is a lack of emotion as the market today is more mechanically driven. I will point out as well that we actually made a lot of money on the decline. As I have often said, that is how our system makes most of its gains.
Back in 2000, our charts started to decline so we sold and went to the F Fund (Bonds) and while the S&P dropped in the neighborhood of 34% we managed a gain of over 9%. While 9% doesn’t sound all that impressive, it was the gains that we made in the coming years that were impressive. For instance, we made a return of close to 42% in the following year while mostly invested in the I Fund. So as we are fond of saying in this group, it’s not what we made in 2000 that was important, it was what we kept! Rather than make back losses as most folks had to do, our gains were pure profit. Now we may not always hit it as perfect as we did in 2000, but we’ll be close enough to make money if we stick to our charts.
Usually when the the market goes down it just doesn’t fall apart in one day. It is a process, and usually as a function of the slowing of momentum we find ourselves sitting on a large amount of cash if not out of equities altogether by the time that the biggest drop occurs. Why am I telling this story once again? Because many of you will start to hear the talk about how we are on another Nasdaq bubble. Declines are nothing to fear. They are an opportunity. We made money in 2000 and we made it again in 2008, and with God’s help will make it the next time the market declines as well. As far as a decline coming soon goes….. I don’t know and neither does anyone else! As far as I’m concerned, the trend is up and we’ll ride it as long as it is…….
The day’s trading left us with the following results: Our TSP allotment gained +0.405%. For comparison the Dow added +0.11%, the Nasdaq +0.41%, and the S&P 500 +0.24%. Praise God for another good day!!
Nasdaq sets closing record
The day’s action left us with the following signals: C-Buy, S-Neutral, I-Buy, F-Neutral. We are currently invested at 05/C, 32/S, 63/I. Our allocation is now +4.50% on the year, not including the days gains. Here are the latest posted results:
| 04/22/15 | |||||
| Fund | G Fund | F Fund | C Fund | S Fund | I Fund |
| Price | 14.701 | 17.0879 | 27.9818 | 38.7193 | 26.4988 |
| $ Change | 0.0007 | -0.0408 | 0.1425 | 0.0853 | -0.0067 |
| % Change day | +0.00% | -0.24% | +0.51% | +0.22% | -0.03% |
| % Change week | +0.03% | -0.47% | +1.29% | +1.07% | +0.84% |
| % Change month | +0.11% | +0.02% | +2.02% | +1.22% | +3.51% |
| % Change year | +0.58% | +1.70% | +3.00% | +6.68% | +9.42% |
| L INC | L 2020 | L 2030 | L 2040 | L 2050 | |
| Price | 17.7258 | 23.6209 | 25.7775 | 27.5482 | 15.7038 |
| $ Change | 0.0100 | 0.0335 | 0.0471 | 0.0580 | 0.0372 |
| % Change day | +0.06% | +0.14% | +0.18% | +0.21% | +0.24% |
| % Change week | +0.22% | +0.55% | +0.71% | +0.82% | +0.93% |
| % Change month | +0.54% | +1.23% | +1.54% | +1.73% | +1.96% |
| % Change year | +1.58% | +3.15% | +3.92% | +4.43% | +4.98% |
Now let’s take a look at the charts.
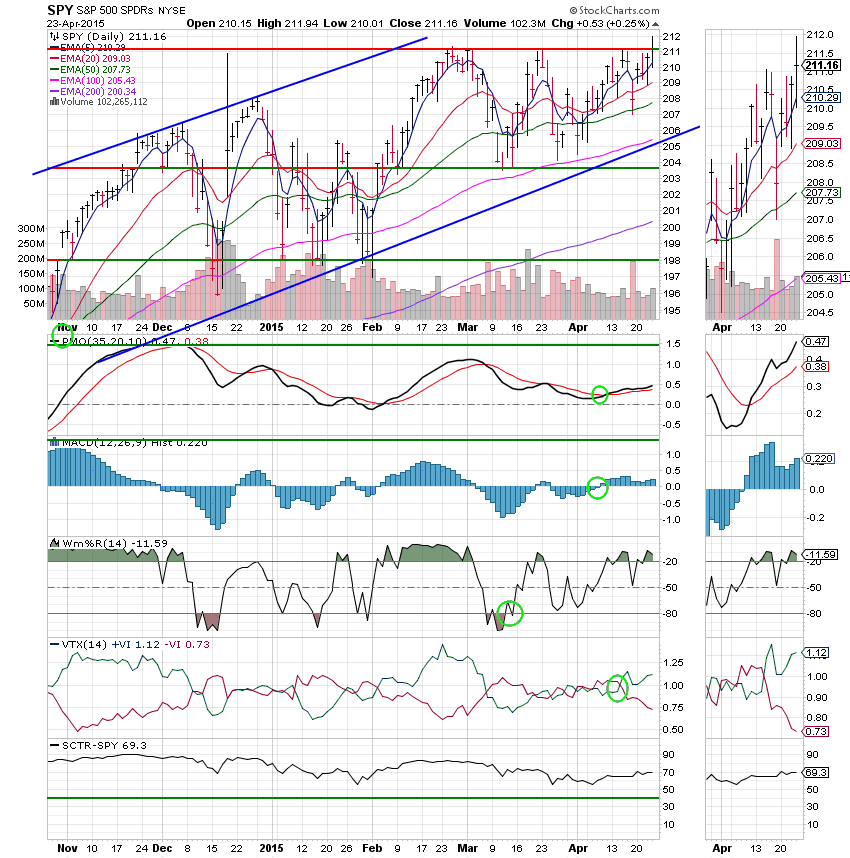
C Fund: Price closed right on resistance at 211 today. We should expect to see more gains if this level can be breached. The C Fund remains on a solid buy signal with all indicators in a positive configuration.
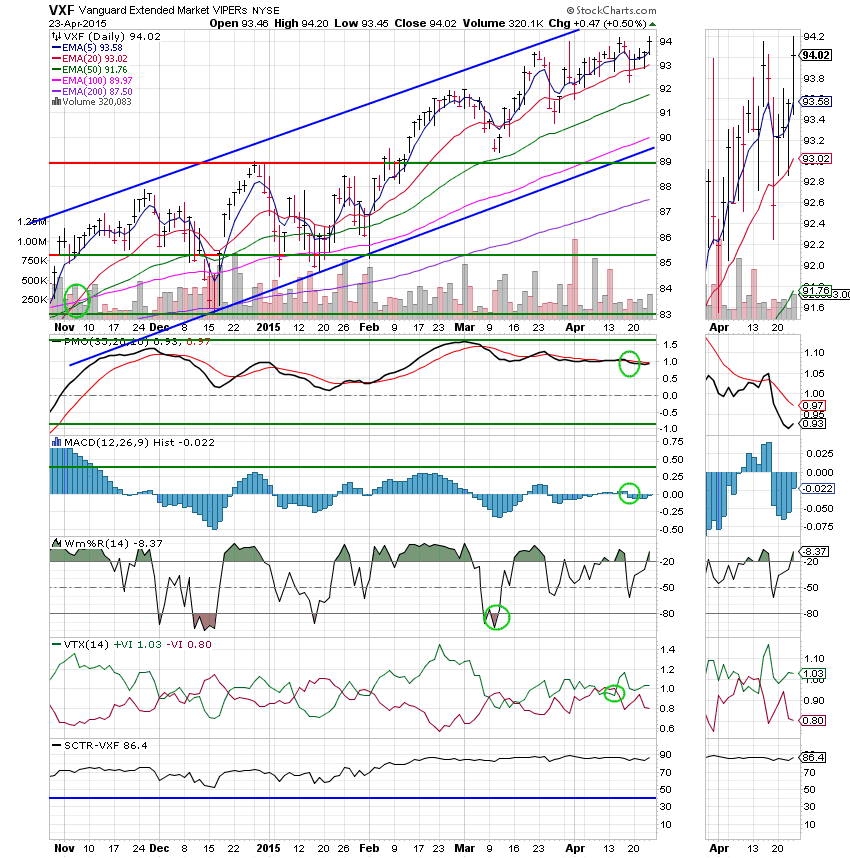
S Fund: The S Fund is getting stronger which is starting to show in all its indicators. If price holds its ground we should see a buy signal here in the coming days. At this time it remains on a neutral signal with the MAC D and PMO in negative configurations.
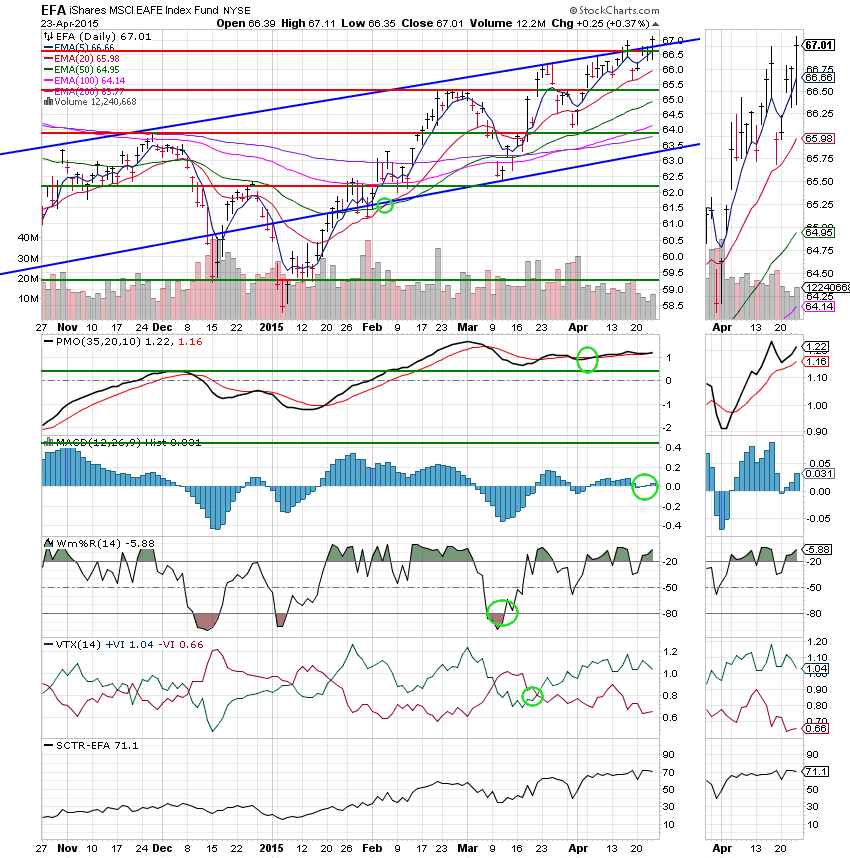
I Fund: Price broke through the upper trend line. If this holds it means that it’s accelerating its rate of gain! That is a good thing as we currently have 63% allocated here. All indicators are currently very strong!
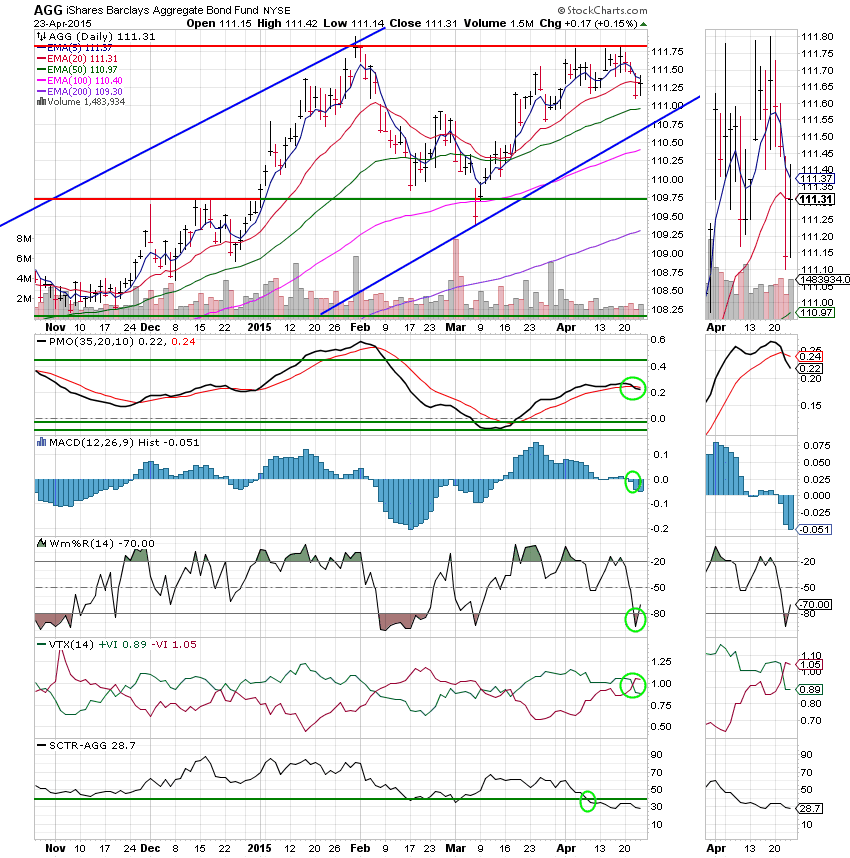
F Fund: The F Fund remains on a neutral signal with the MAC D and PMO in negative configurations. The Williams %R moved turned up indicating some short term gains but the SCTR is looking very weak at this time and that indicates that there are better places to put your money…..
That’s all for tonight. May God continue to bless your trades!