
Good Evening,
The market started flat but picked up steam in the afternoon as it cheered the fact that unemployment claims remained at a 15 year low. It also received some tail winds from lower oil prices. The major indices all managed moderate gains on the day, but the bounce didn’t have a lot of conviction. Probably because the market is waiting for the jobs report to be issued by the US Department of Labor tomorrow at 8:30 AM ET. The main focus of investors will be how the report might effect the Fed’s decision to raise interest rates. At this point, it’s anybody’s guess how the market will react to the report. I miss the days when good news meant good markets and vice versa. I hate to sound like a broken record but all we can do is watch our charts closely and play the action that’s before us.
The day’s trading left us with the following results: Our TSP allotment closed slightly off at -0.053% as the I Fund finished in the red for the day. For comparison, the Dow gained +0.46%, the Nasdaq +0.53%, and the S&P 500 +0.38%. I thank God for a good day for the market.
Jobless claims hover near 15-year low, boost growth outlook
The day’s action left us with the following signals: C-Neutral, S-Neutral, I-Neutral, F-Sell. We are currently invested at 23/C, 14/S, 63/I. Our allocation is now +3.82% on the year, not including the day’s results. Here are the latest posted results:
| 05/06/15 | |||||
| Fund | G Fund | F Fund | C Fund | S Fund | I Fund |
| Price | 14.7119 | 16.8826 | 27.6348 | 37.5807 | 26.5756 |
| $ Change | 0.0008 | -0.0446 | -0.1134 | 0.0370 | 0.1571 |
| % Change day | +0.01% | -0.26% | -0.41% | +0.10% | +0.59% |
| % Change week | +0.03% | -0.53% | -1.29% | -0.97% | -0.02% |
| % Change month | +0.03% | -0.90% | -0.21% | -0.26% | -0.29% |
| % Change year | +0.65% | +0.48% | +1.73% | +3.54% | +9.73% |
| L INC | L 2020 | L 2030 | L 2040 | L 2050 | |
| Price | 17.6835 | 23.4882 | 25.579 | 27.2897 | 15.5427 |
| $ Change | -0.0049 | -0.0059 | -0.0070 | -0.0078 | -0.0025 |
| % Change day | -0.03% | -0.03% | -0.03% | -0.03% | -0.02% |
| % Change week | -0.20% | -0.45% | -0.58% | -0.68% | -0.74% |
| % Change month | -0.08% | -0.15% | -0.20% | -0.23% | -0.24% |
| % Change year | +1.33% | +2.57% | +3.12% | +3.45% | +3.90% |
Now, let’s look at the important stuff. Here are the charts!
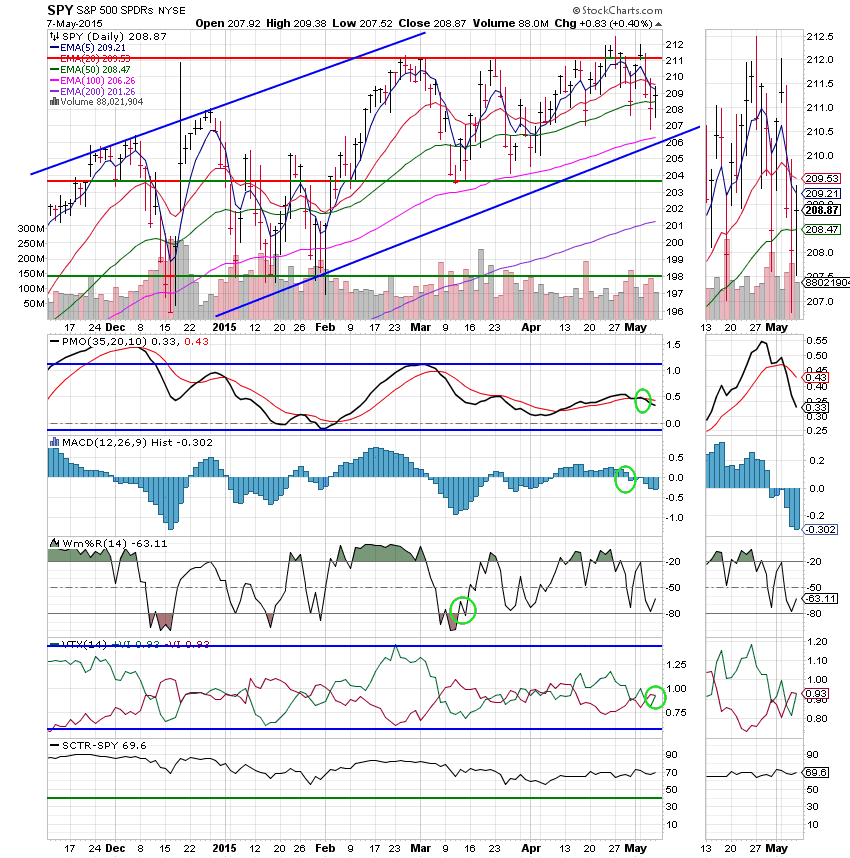
C Fund: Price reclaimed its 50 EMA. The VTX whipsawed to a positive signal and the Williams %R turned up. This chart got a little stronger today.
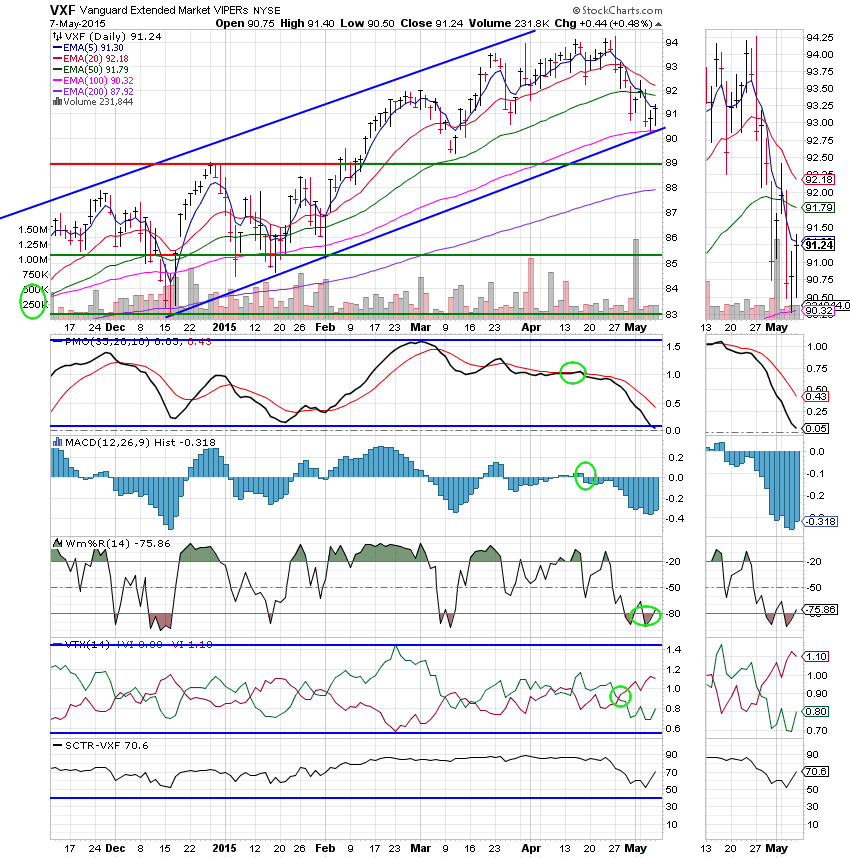
S Fund: The S Fund made a nice gain today with the MAC D, Williams %R, VTX, and SCTR all heading up. While price has yet to regain its 50 EMA the overall chart is starting to strengthen and would not generate a sell signal even if the 20 EMA crossed through the 50 EMA as the Williams %R is now in a positive configuration. Let’s pray that this is the beginning of small caps leading us back up!
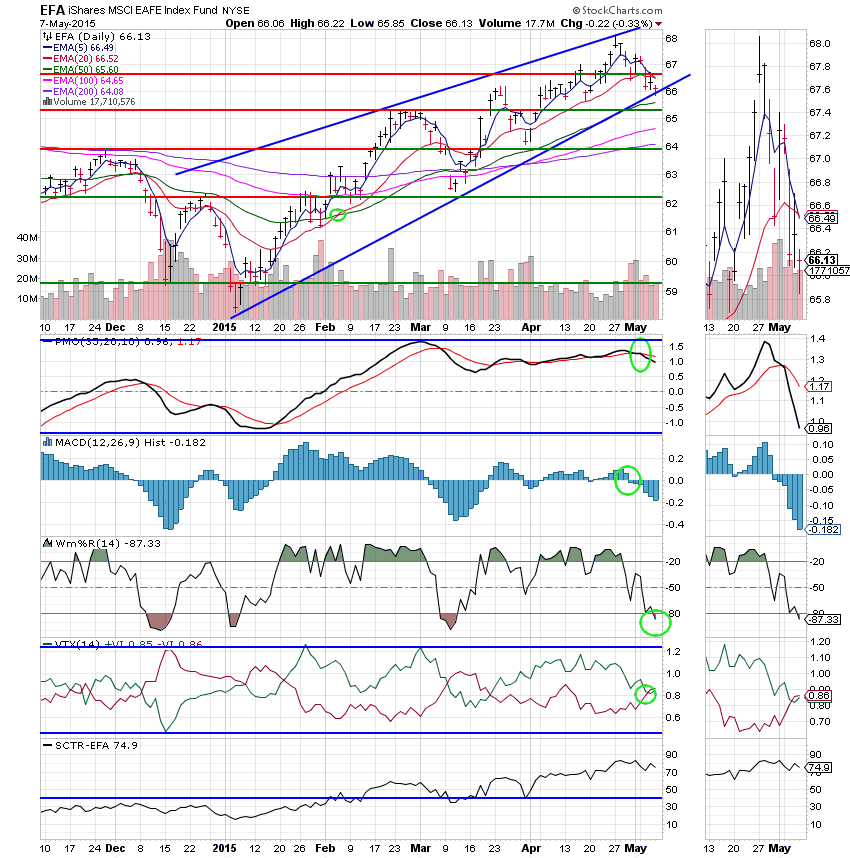
I Fund: Price took a step back today, but still remains above its 50 EMA as well as the lower trend line. While the Williams %R went into a negative configuration, it has rebounded quickly each time it has reached that point in recent history. This chart looks extended to the down side and ready to bounce. Yes, I’m still bullish about this one!
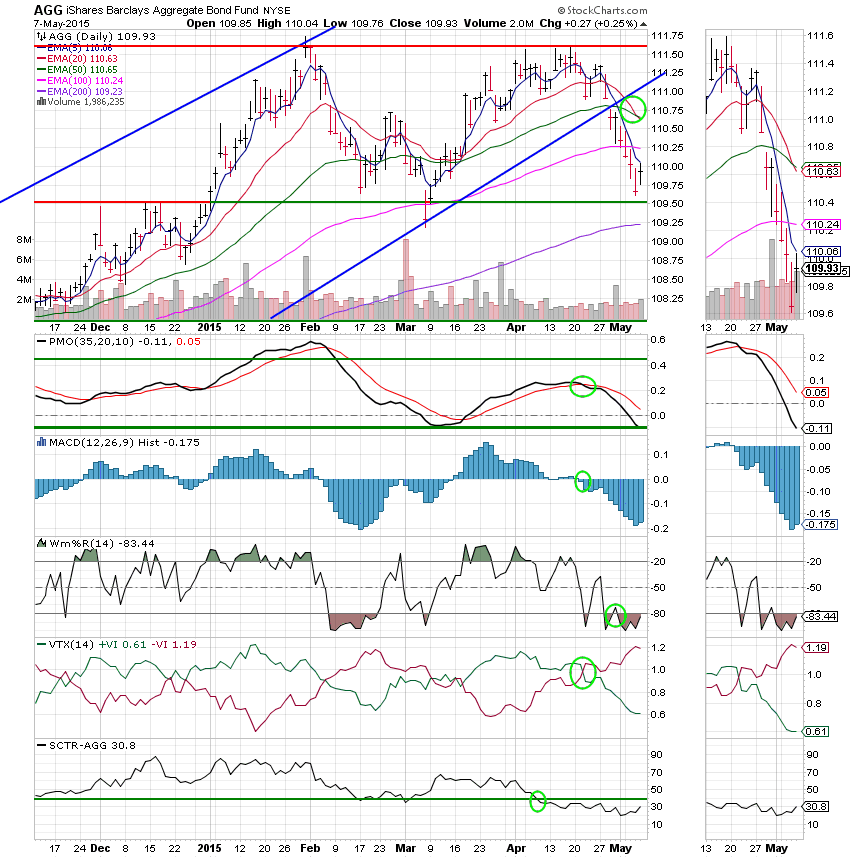
F Fund: Price bounced today. However, it is still in a downtrend and should not be trusted until price regains its 50 EMA. All indicators remain negative and the PMO is in a free fall.
As I said in my opening comments, it’s all about the jobs report in the morning or more precisely, how the market reacts to it. Will good news still get a bad reaction as the market anticipates the Fed raising rates? Only time will tell. This market feels like it still wants to run to me. It feels a little extended to the downside and ready to jump. It also feels like it’s dealing with a little indecision after Janet Yellen’s untimely remarks. I love Janet. She is very good at what she does, but that does not qualify her as a stock analyst. My indicators tell me that this is far from a done deal. I’m staying invested, watching my charts, and trusting my God. Give Him all the Praise! Have a great evening!