
Good Evening,
Stocks gapped up this morning and caught the under-invested bulls flatfooted again. The market followed that all too familiar pattern of moving up all afternoon after a gap without providing even a small dip for an entry point. I have commented on this change several times and have openly wondered about whether the old days of trading would ever return. As time goes by I am more and more convinced that the way that we traded prior to 2009 is gone with the wind. If this market follows the recent trend it will continue up and severely punish those that took a defensive posture during the recent weakness. The under-the-surface action today indicated that this is probably the case as large- and mid-cap value stocks were the laggards leading us to believe that funds were rotating out of those areas and into more speculative high risk/ high return stocks and ETF’s.
I’m quite sure that the great liquidity created by the central bankers has been a driver of this one way action. But, it is my personal belief that the high-speed computer trading has been responsible to an even greater degree.While there is no doubt that the FED money will eventually dry up, the machines are here to stay. Large firms with a lot of money and ready access to these machines are easily able to take advantage of a day like today and are making nice gains by doing it. Is this manipulation? Whatever you call it, it is driving most average traders nuts.
I was discussing the matter with a close friend today. I’ll tell you what I told him: I remember trading in the 90’s prior to the dot com bubble. Yes there were more dips then than there are now, but for the most part folks would set it and forget it. It didn’t take a lot of special knowledge to make money. All you needed was some capital and an account in which to trade it. Most Thrift participants just put their money in the C Fund and let it ride the whole way. That was great until things changed in 2000 when the tech bubble burst. We had to adjust to the changes then and with God’s help we did so successfully. 2009 brought yet another change. How long the market will trade like this, I really don’t know, but what I do know is that there is always a way to make money. You just have to find it. You just have to deal with it. Think about it. Do you really have a choice? It is what it is. Our system seems to have adapted well to the changes at this time. Let’s hope that it’s a long while before we have to figure it out again. I have no doubt that with God’s help and a little hard work on the charts that we will always be able to adapt to whatever Mr. Market throws our way!
The day’s action left us with the following results: Our TSP allotment made a very nice gain of 1.134%. For comparison, the Dow added +1.06%, the Nasdaq +1.39%, and the S&P 500 +1.08% Praise God for a wonderful day!
S&P 500 ends at record high as dollar loses ground
The day’s trading left us with the following signals: C-Buy, S-Neutral, I-Buy, F-Sell. We are currently invested at 23/C, 14/S, 63/I. Our allocation is now +5.20% on the year, not including the day’s gains. Here are the latest posted results.
| 05/13/15 | |||||
| Fund | G Fund | F Fund | C Fund | S Fund | I Fund |
| Price | 14.7175 | 16.862 | 27.8995 | 37.9693 | 26.9853 |
| $ Change | 0.0008 | -0.0136 | -0.0023 | -0.0094 | 0.2289 |
| % Change day | +0.01% | -0.08% | -0.01% | -0.02% | +0.86% |
| % Change week | +0.03% | -0.58% | -0.78% | -0.27% | +0.68% |
| % Change month | +0.07% | -1.02% | +0.75% | +0.77% | +1.25% |
| % Change year | +0.69% | +0.36% | +2.70% | +4.61% | +11.43% |
| L INC | L 2020 | L 2030 | L 2040 | L 2050 | |
| Price | 17.7267 | 23.6261 | 25.7706 | 27.5233 | 15.6942 |
| $ Change | 0.0071 | 0.0290 | 0.0396 | 0.0466 | 0.0319 |
| % Change day | +0.04% | +0.12% | +0.15% | +0.17% | +0.20% |
| % Change week | -0.08% | -0.15% | -0.20% | -0.23% | -0.23% |
| % Change month | +0.17% | +0.43% | +0.55% | +0.63% | +0.73% |
| % Change year | +1.58% | +3.18% | +3.89% | +4.34% | +4.92% |
Now let’s hit the carts.
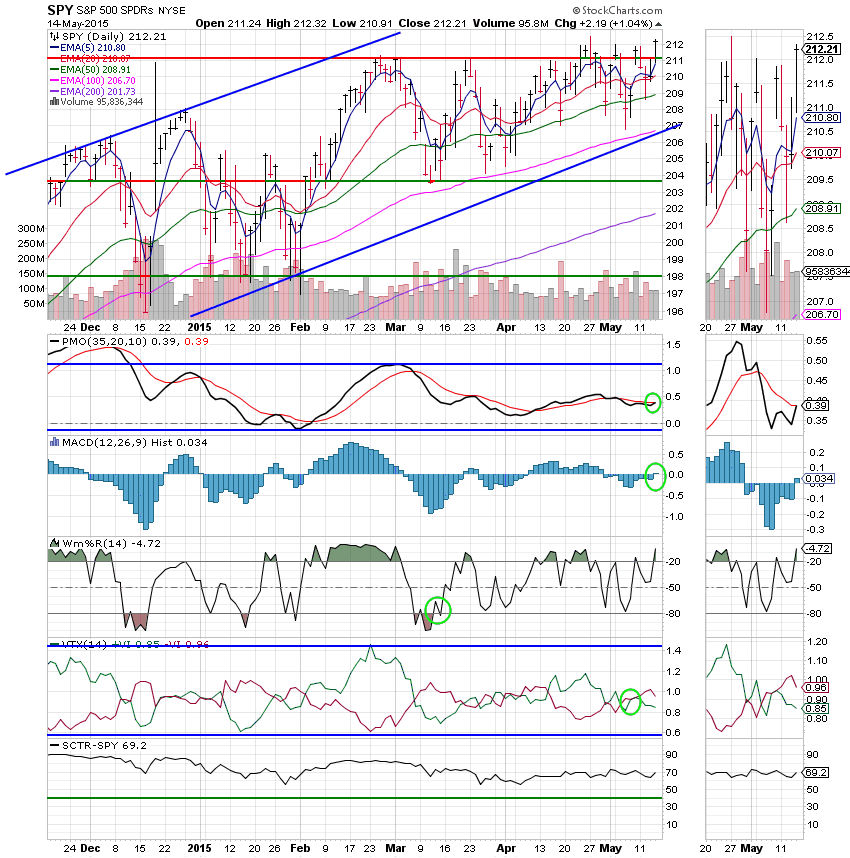
C Fund: What’s not to like? Price shattered resistance at a little over 211. That resistance is now support. The PMO and MAC D both moved into positive configurations generating an overall buy signal for this chart.
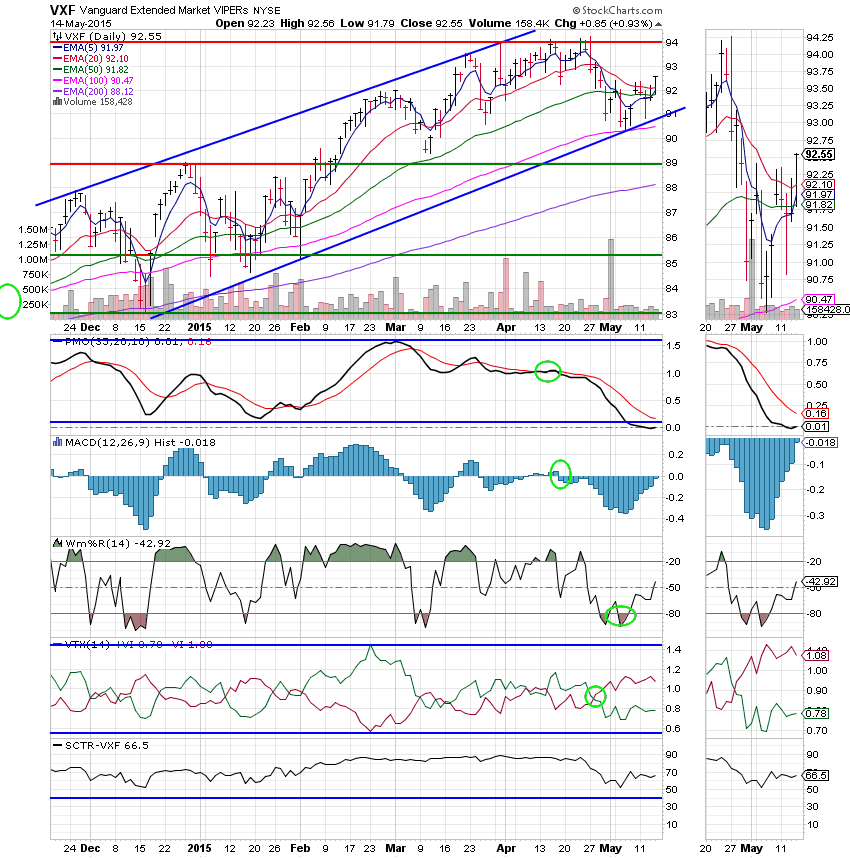
S Fund: The S Fund made a nice gain today with price moving back above its 20 EMA. The remaining indicators are improving but still have a little work to do before this chart can generate a buy signal. The S Fund remains neutral for now.
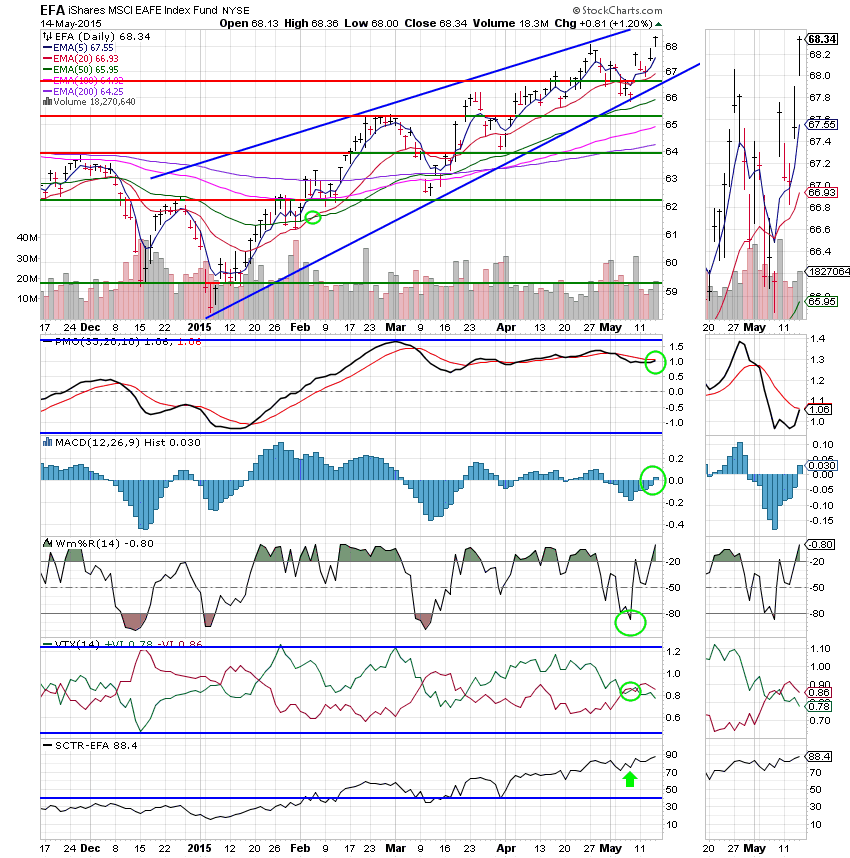
I Fund: If you don’t see why I am bullish on the I Fund by now then you probably need to read another blog! The I fund chalked up another stellar gain today with price moving to a new high for the year at 68.34. The PMO and MAC D both moved into positive configurations which generated an overall buy signal for this chart. The SCTR moved up to a solid 88.4. This fund is on the move!
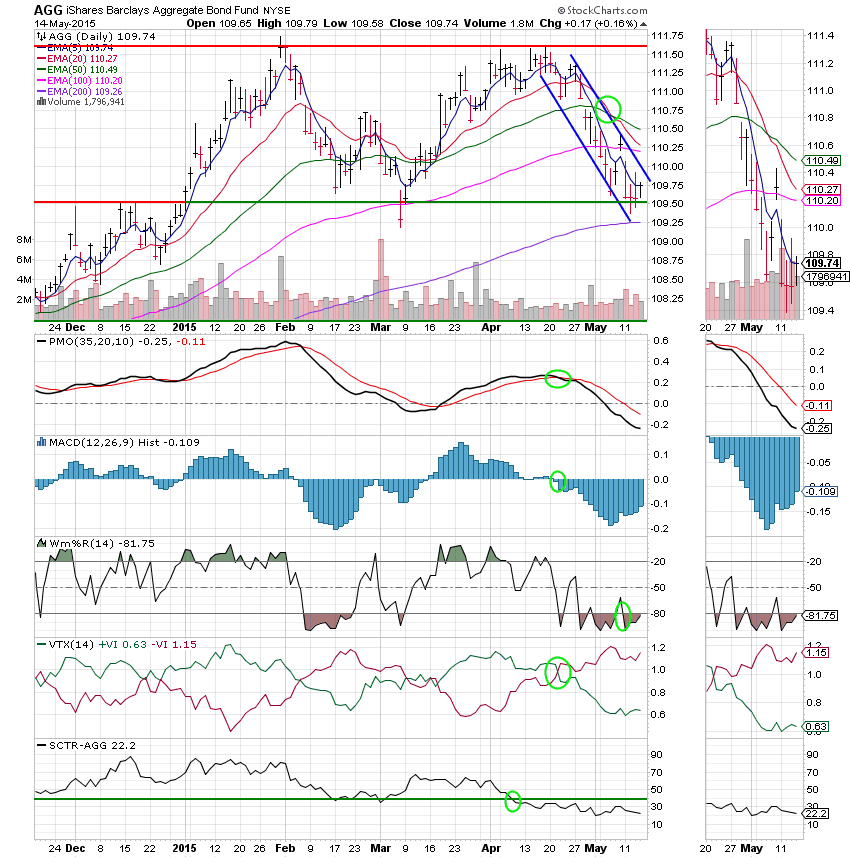
F Fund: Price managed a small gain today, but this fund is in sold downtrend with all indicators in negative configurations. The SCTR reflects this downtrend with a reading of only 22.2.
Not to be redundant, but our job is to continue to monitor the charts for changes. Right now though, it’s steady as she goes. May God continue to bless your trades. Have a nice evening.
God bless,
Scott![]()