
Good Evening, This is the first time I can remember downward pressure on bonds effecting stocks. The TLT suffered again today and took stocks along for the ride. This is the fourth negative day in a row for the market. Could it’s character be changing? Yes it could. Right now the market feels like it’s waiting for next weeks FOMC meeting to make it’s next move. Until then it looks like we’ll probably have an indecisive market with a negative bias.
After the morning selloff, the dip buyers showed up right on cue to drive us off the lows of the day. After that. everything went according to script with stocks unable to gain any traction finishing mixed on the day. I would describe the day as flat. The days trading left us with the following results: Our TSP allotment slipped back another -0.264%. For comparison, the Dow finished flat at -0.01%, the Nasdaq dropped -0.15%, and the S&P broke it’s 3 day losing streak by adding +0.04%. Like I said, the day was flat!
Wall Street ends flat; S&P 500 snaps three-day losing streak
The days action left us with the following signals: C-Neutral, S-Neutral, I-Neutral, F-Sell. We are currently invested at 29/C, 37/S, 34/I. Our allocation is now +3.35% on the year not including the days results. Here are the latest posted results:
| 06/08/15 | |||||
| Fund | G Fund | F Fund | C Fund | S Fund | I Fund |
| Price | 14.7385 | 16.7854 | 27.6923 | 38.3037 | 26.0606 |
| $ Change | 0.0024 | 0.0232 | -0.1758 | -0.2772 | -0.0245 |
| % Change day | +0.02% | +0.14% | -0.63% | -0.72% | -0.09% |
| % Change week | +0.02% | +0.14% | -0.63% | -0.72% | -0.09% |
| % Change month | +0.04% | -1.21% | -1.28% | -0.17% | -1.81% |
| % Change year | +0.83% | -0.10% | +1.94% | +5.53% | +7.61% |
| L INC | L 2020 | L 2030 | L 2040 | L 2050 | |
| Price | 17.6994 | 23.4822 | 25.5679 | 27.2844 | 15.5332 |
| $ Change | -0.0144 | -0.0539 | -0.0790 | -0.1001 | -0.0643 |
| % Change day | -0.08% | -0.23% | -0.31% | -0.37% | -0.41% |
| % Change week | -0.08% | -0.23% | -0.31% | -0.37% | -0.41% |
| % Change month | -0.29% | -0.68% | -0.86% | -0.96% | -1.07% |
| % Change year | +1.42% | +2.55% | +3.07% | +3.43% | +3.84% |
Lets take a look at the charts. (All signals annotated with Green Circles)
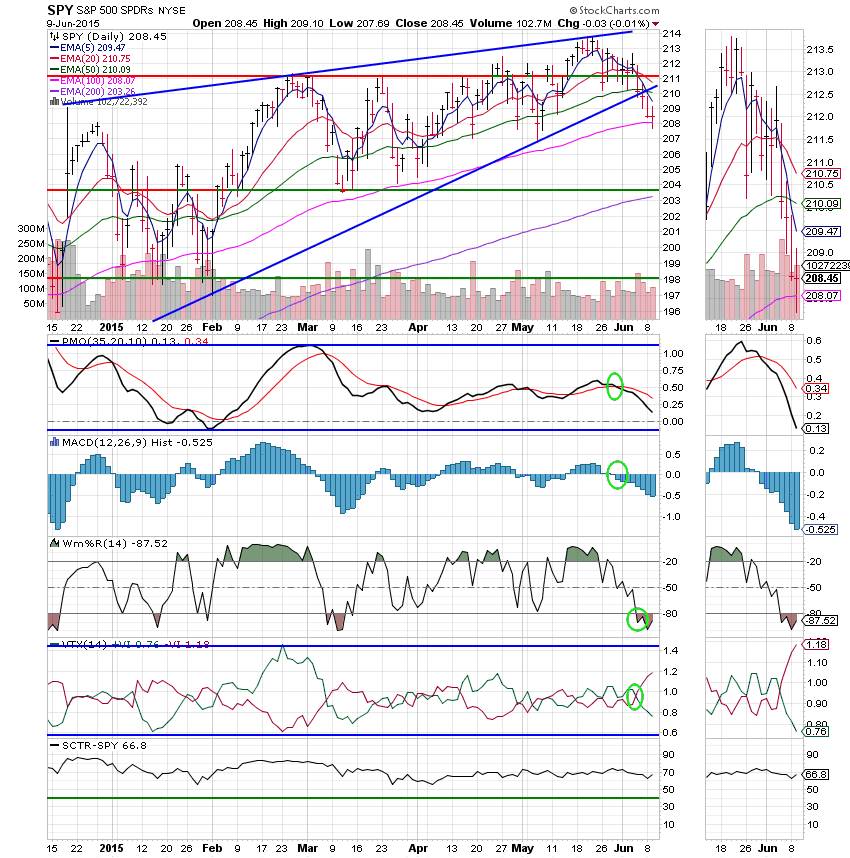
C Fund: Price finished flat today, but flat will not be good enough for long as it is currently below it’s 50 EMA and is dragging the 20 EMA closer to a negative crossover. Resistance at the 100 EMA is holding for now.
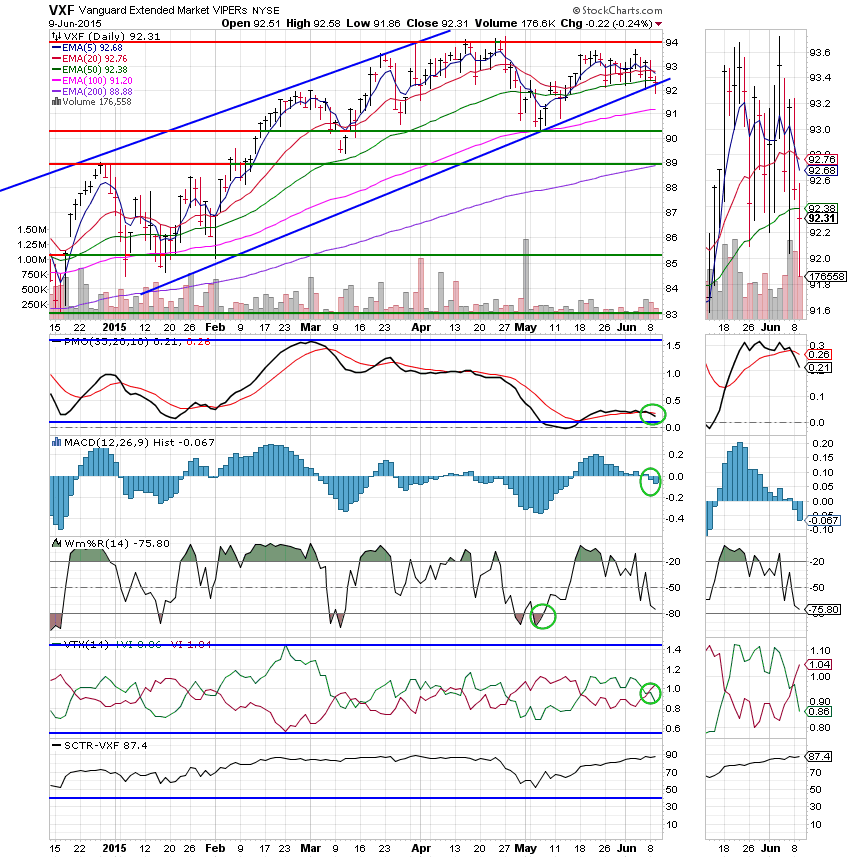
S Fund: Price moved below it’s 50 EMA today. The remainder of the signals continued to weaken. That said the SCTR moved up to 87.4 which should tell you how weak everything else is.
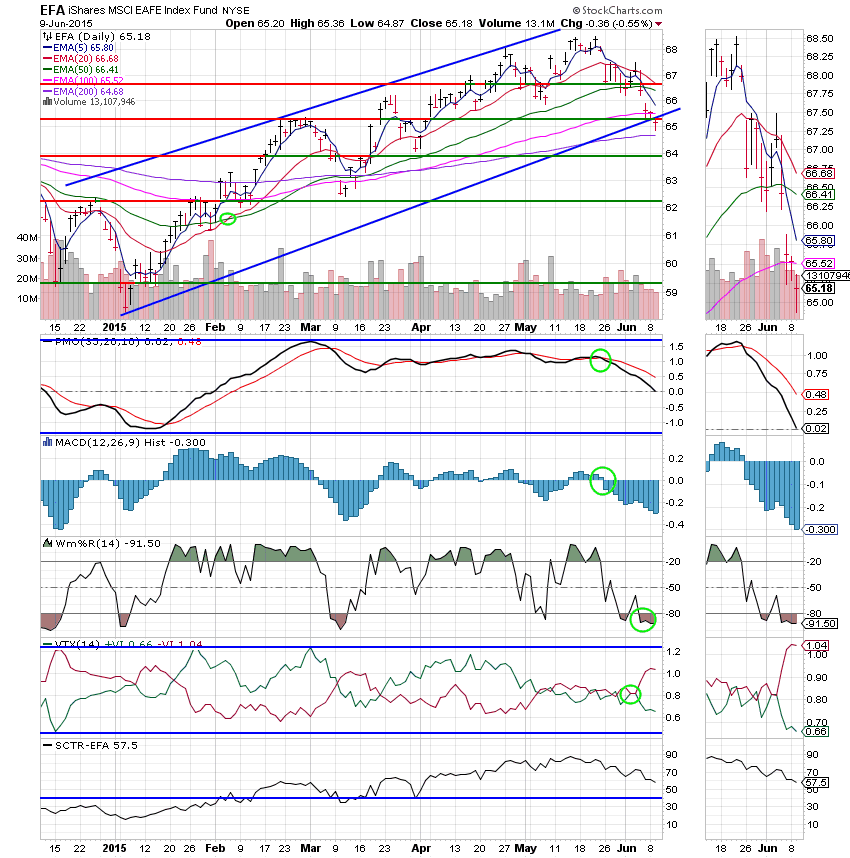
I Fund: Price moved below it’s 100 EMA and is dragging the 20 EMA down toward a negative crossover of the 50 EMA which will trigger a sell signal barring improvement in any of the other indicators that also continue to weaken for now. The I Fund is now the closest of our equity based funds to generating a sell signal. It’s weakness is reflected by an SCTR of 57.5.
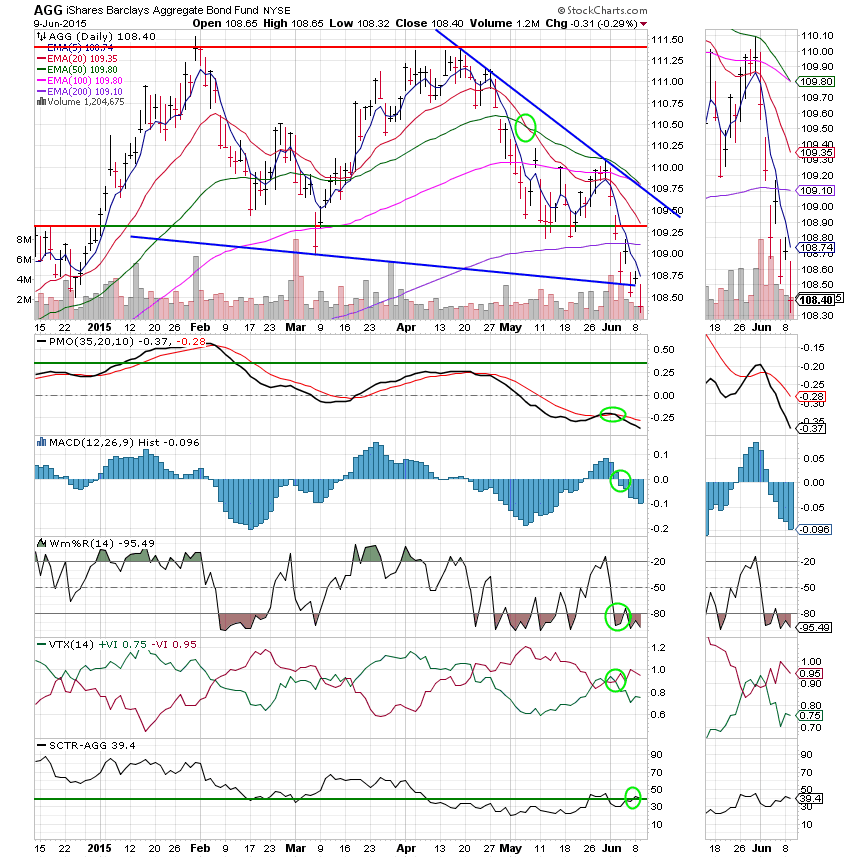
F Fund: The F Fund continues to fall. Today, the 20 EMA passed through the 50 EMA which I consider to be very bearish. The chart is moving ever closer to bear territory. I define a chart to be in a bear market when it is upside down. In other words, when the 5 EMA is on the bottom and the 200 EMA is on the top. Bonds are taking a beating with no relief in sight!
OK, I don’t speculate, but I have feelings like everybody else and right now this market feels like it could be topping. Of course, I’ll watch my charts and do what the tell me irregardless of what I think. Also, I would be amiss not to say that I will seek the guidance of our Heavenly Father before I do anything else. Give Him all the praise! That’s all for tonight. Keep praying! It’s times like these when our decisions determine whether or not we have a good year. Have a great evening!