Good Evening, Today the market was all about oil again. The crazy thing about it is that stocks are going the opposite direction that they should go in with rising oil. I know that it’s Santa Rally time, arguably the best three weeks in the year, but the market reaction to oil is crazy! Only 7% of stocks in the NYSE actually benefit from higher oil prices. That means that 93% do not. So why are they trading in lock step with oil??? I say (and I’m not the only one) that trading computer algorithms are currently programed to buy when oil goes up. Why is it that way? My best guess is that it takes advantage of the psychology of the herd and has nothing to do with fundamentals. That is the reason that the major indices and the charts have often been misleading in the past few years which has led to large scale hedge fund underperformance. In short it’s been hard as heck to navigate this market. The action has spawned a new generation of traders that know nothing but to buy and hold. That is OK when there is not a lot of market variance, but what about when it goes down? I mean when it really goes down! This generation of traders has not experienced that. Thus, they really have no fear of it. All that said, my experience is that there is always a way to make money and if what your doing is not working then you need to tweak your trading model just a bit. That’s what I intend to do….you must always strive for efficiency!
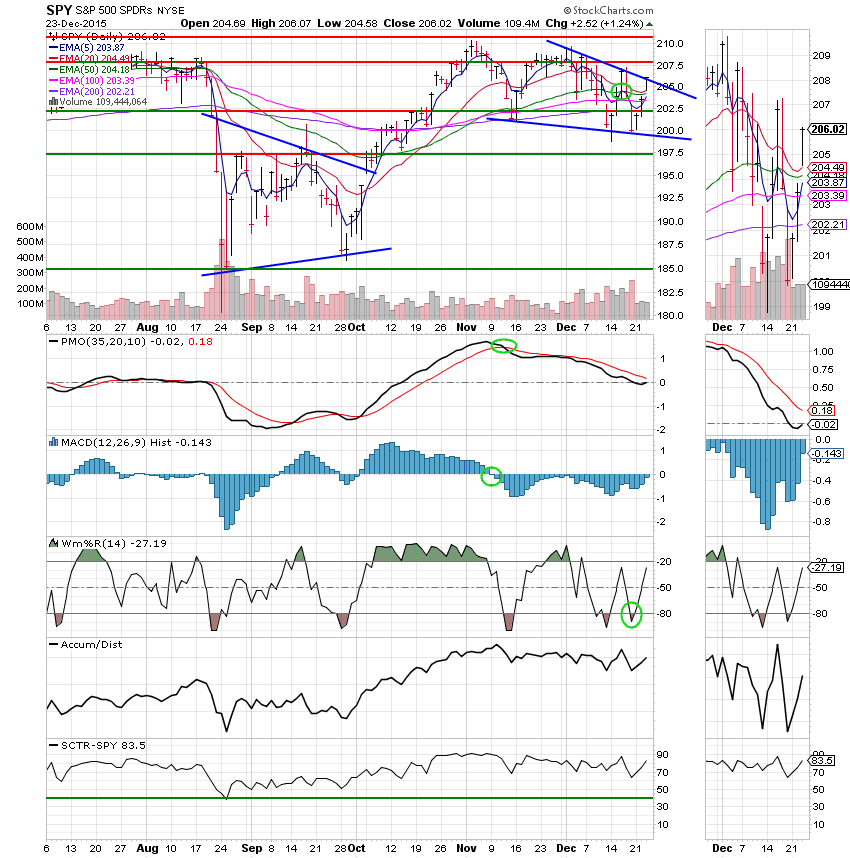
The days action left us with the following results: Our TSP allotment was steady in the G Fund. For comparison, the Dow gained +1.06%, the Nasdaq +0.90%, and the S&P 500 +1.24%. So far we’ve sat this one out. We’ll keep an eye on our charts. It’s tough to find a good entry point at this time.
On Wall Street, oil proffers modest Santa Claus rally
The days action left us with the following signals: C-Neutral, S-Sell, I-Sell, F-Sell. We are currently invested at 100/G. Our allocation is now +0.20% on the year not including the days results. Here are the latest posted results:
| 12/22/15 | Prior Prices | ||||
| Fund | G Fund | F Fund | C Fund | S Fund | I Fund |
| Price | 14.9076 | 16.9607 | 27.4848 | 35.0903 | 23.8679 |
| $ Change | 0.0009 | -0.0364 | 0.2435 | 0.2869 | 0.0936 |
| % Change day | +0.01% | -0.21% | +0.89% | +0.82% | +0.39% |
| % Change week | +0.02% | -0.22% | +1.70% | +1.40% | +0.13% |
| % Change month | +0.13% | -0.26% | -1.85% | -4.31% | -2.95% |
| % Change year | +1.99% | +0.95% | +1.18% | -3.32% | -1.45% |
| L INC | L 2020 | L 2030 | L 2040 | L 2050 | |
| Price | 17.7493 | 23.1452 | 24.9775 | 26.4695 | 14.9611 |
| $ Change | 0.0255 | 0.0801 | 0.1155 | 0.1424 | 0.0908 |
| % Change day | +0.14% | +0.35% | +0.46% | +0.54% | +0.61% |
| % Change week | +0.25% | +0.57% | +0.76% | +0.88% | +0.98% |
| % Change month | -0.41% | -1.19% | -1.66% | -1.98% | -2.27% |
| % Change year | +1.71% | +1.08% | +0.69% | +0.34% | +0.02% |