Good Evening, Back in the day there used to be a show on television called Dragnet about two detectives in LA. It seemed like they were always interviewing a suspect or witness for a crime that they were investigating. Almost inevitably the person they were interviewing which for some reason was often a women would get carried away while answering a question. At that time Detective Joe Friday would always interrupt and say rather dryly ” The facts Maam, just the facts”. Well that’s what I am trying to give you here, just the facts. We add many more indepth articles that you can study when you have more time on our facebook page. What most of you have told me you want is just enough content to review quickly each evening without taking time away from your families and activities. So, as I have mentioned a few times lately, that is what I am trying to do. Just the facts!
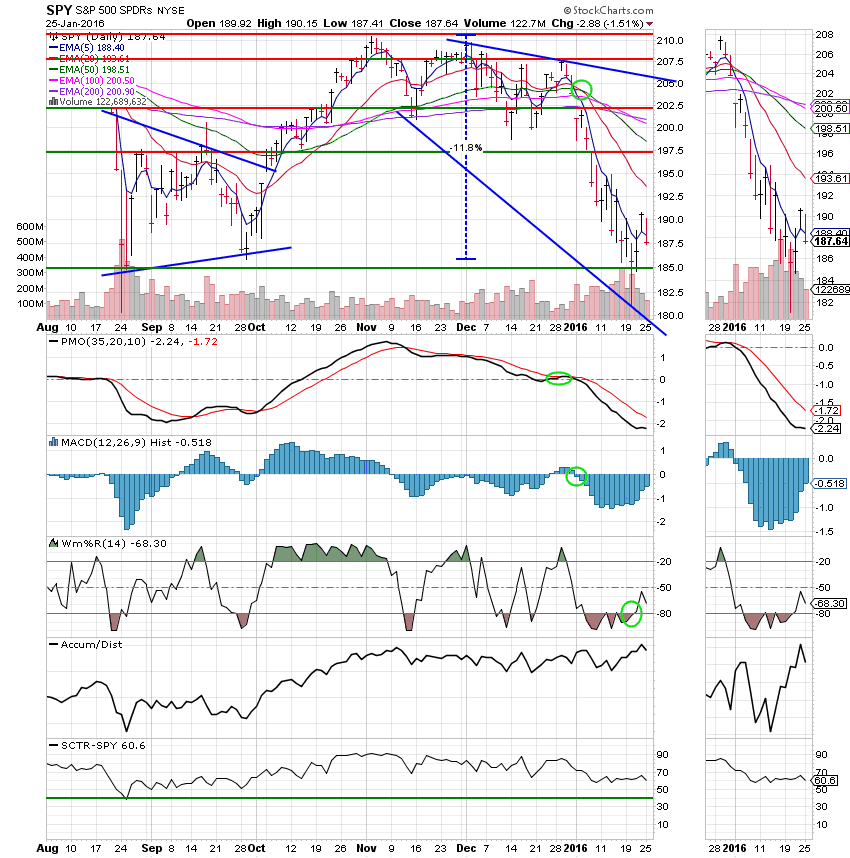
Today’s action was once again a result of Oil and the market moving in lock step. Oil went down and the market wasn’t far behind. As I noted last week, the upside that we experienced was no more than an oversold bounce. The selling today was a classic example of a failed bounce that occurs during a downtrending market. It was pointed out to me that we haven’t yet reached the classic definition of a bear market which is a dip of 20 percent or more. Well, it may not be, but it sure feels like one to me. I will be extremely surprised if we don’t experience more downside. My charts don’t indicate anything at this time that tells me that we are in not in a downtrend. By the matter of fact, according to technical analysis, we entered a bear market when the 50 EMA crossed down through the 200 EMA on our chart for the S&P 500. What is it they say? If it walks like a duck and quacks like a duck then it’s probably a duck? Well, if it walks like a bear and growls like a bear, then it’s probably a bear. Moral of the story? Don’t get in a big hurry to stick you money back into equities!
Wall Street weighed down by energy stocks
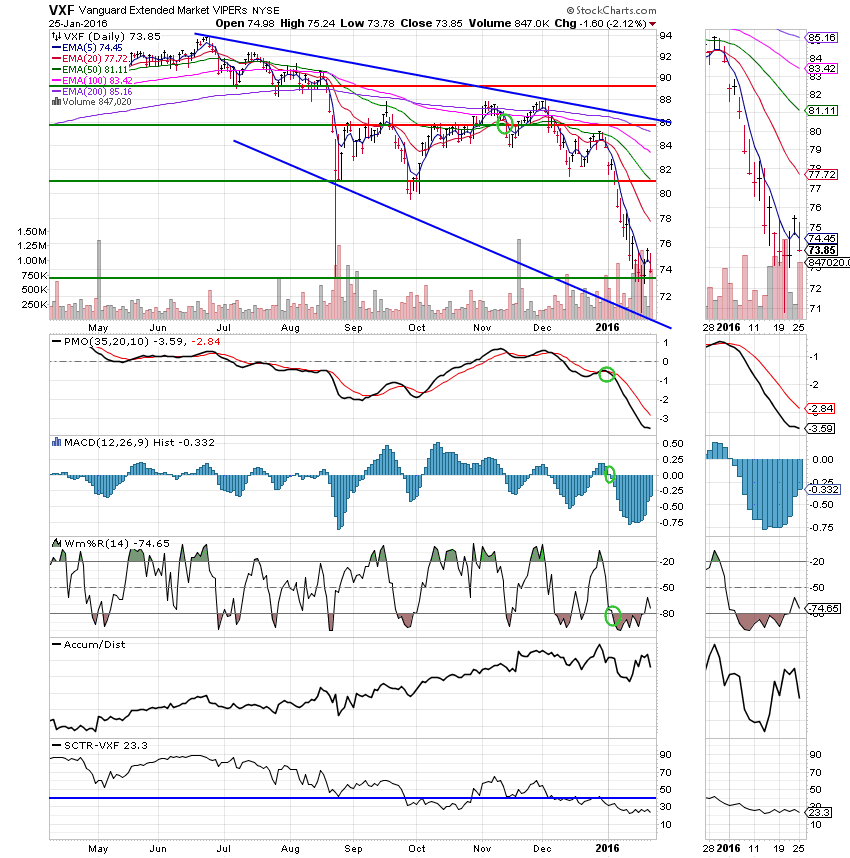
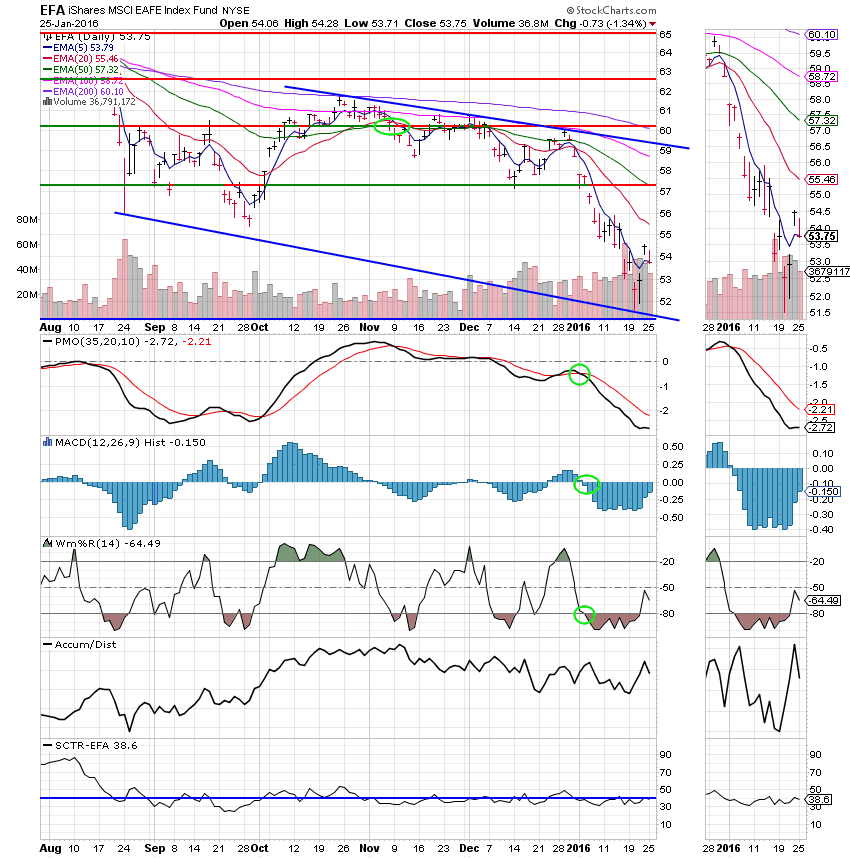
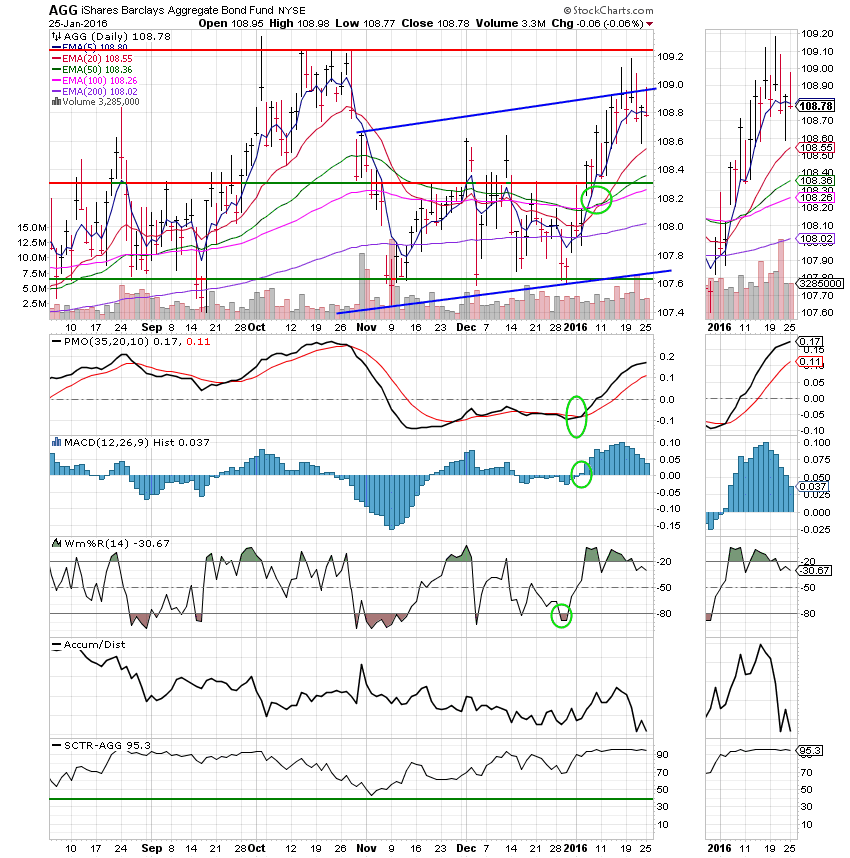
The days action left us with the following signals: C-Sell, S-Sell, I-Sell, F-Buy. We are currently invested at 100/G. Our allocation is now +0.13% on the year not including the days results. Here are the latest posted results:
| 01/22/16 | Prior Prices | ||||
| Fund | G Fund | F Fund | C Fund | S Fund | I Fund |
| Price | 14.9355 | 17.1069 | 25.7413 | 31.7509 | 22.1752 |
| $ Change | 0.0009 | -0.0090 | 0.5119 | 0.7683 | 0.5050 |
| % Change day | +0.01% | -0.05% | +2.03% | +2.48% | +2.33% |
| % Change week | +0.04% | -0.11% | +1.43% | +1.10% | +1.24% |
| % Change month | +0.13% | +0.90% | -6.61% | -9.89% | -7.97% |
| % Change year | +0.13% | +0.90% | -6.61% | -9.89% | -7.97% |
| L INC | L 2020 | L 2030 | L 2040 | L 2050 | |
| Price | 17.531 | 22.4008 | 23.8614 | 25.0835 | 14.0643 |
| $ Change | 0.0768 | 0.2285 | 0.3316 | 0.4037 | 0.2566 |
| % Change day | +0.44% | +1.03% | +1.41% | +1.64% | +1.86% |
| % Change week | +0.29% | +0.64% | +0.86% | +0.99% | +1.11% |
| % Change month | -1.36% | -3.48% | -4.80% | -5.60% | -6.40% |
| % Change year | -1.36% | -3.48% | -4.80% | -5.60% | -6.40% |