Good Evening, The market had reassuring words from Janet Yellen and good news from Deutche Bank, but in the end it wasn’t enough. After rallying most of the day, the market sold off in the afternoon finishing at it’s lows of the day. Of the major indices, only the Nasdaq managed to close in the green. The days negatives were weakness in oil and financials. If you ask me, it’s just typical bear market action. Trapped bulls are going take every opportunity to escape by selling into strength…..
The days trading left us with the following results: Our TSP allotment was steady in the G Fund. For comparison the Dow dropped -0.62%, the Nasdaq held onto +0.35%, and the S&P 500 was flat at -0.02%. Like it or not, this market is still in a downtrend.
S&P 500 ends flat; Fed sees risks but unlikely to reverse course
The days action left us with the following signals: C-Sell, S-Sell, I-Sell, F-Buy. We are currently invested at 100/G. Our allocation is now +0.24% on the year not including the days results. Here are the latest posted results:
| 02/09/16 | Prior Prices | ||||
| Fund | G Fund | F Fund | C Fund | S Fund | I Fund |
| Price | 14.9508 | 17.3064 | 25.0341 | 29.9402 | 21.4463 |
| $ Change | 0.0008 | -0.0078 | -0.0116 | -0.1743 | -0.2095 |
| % Change day | +0.01% | -0.05% | -0.05% | -0.58% | -0.97% |
| % Change week | +0.02% | +0.38% | -1.45% | -2.91% | -3.25% |
| % Change month | +0.05% | +0.58% | -4.44% | -6.91% | -5.69% |
| % Change year | +0.24% | +2.07% | -9.17% | -15.03% | -10.99% |
| L INC | L 2020 | L 2030 | L 2040 | L 2050 | |
| Price | 17.4404 | 22.0741 | 23.3675 | 24.469 | 13.6643 |
| $ Change | -0.0134 | -0.0411 | -0.0607 | -0.0748 | -0.0480 |
| % Change day | -0.08% | -0.19% | -0.26% | -0.30% | -0.35% |
| % Change week | -0.40% | -1.00% | -1.39% | -1.63% | -1.88% |
| % Change month | -0.97% | -2.40% | -3.31% | -3.86% | -4.42% |
| % Change year | -1.87% | -4.89% | -6.77% | -7.91% | -9.06% |
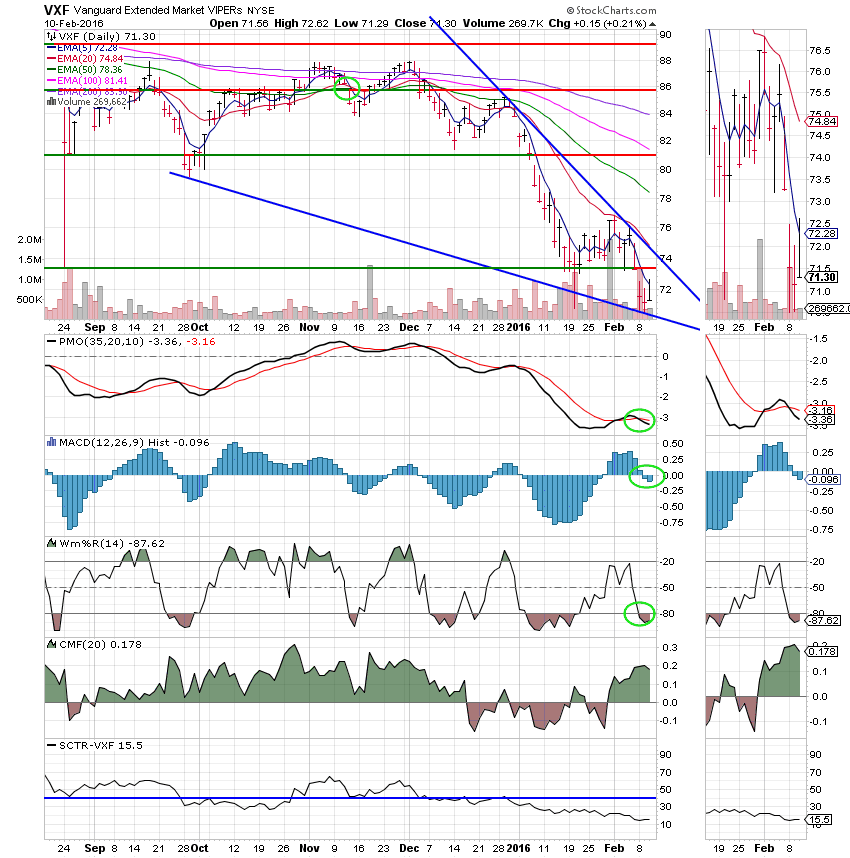
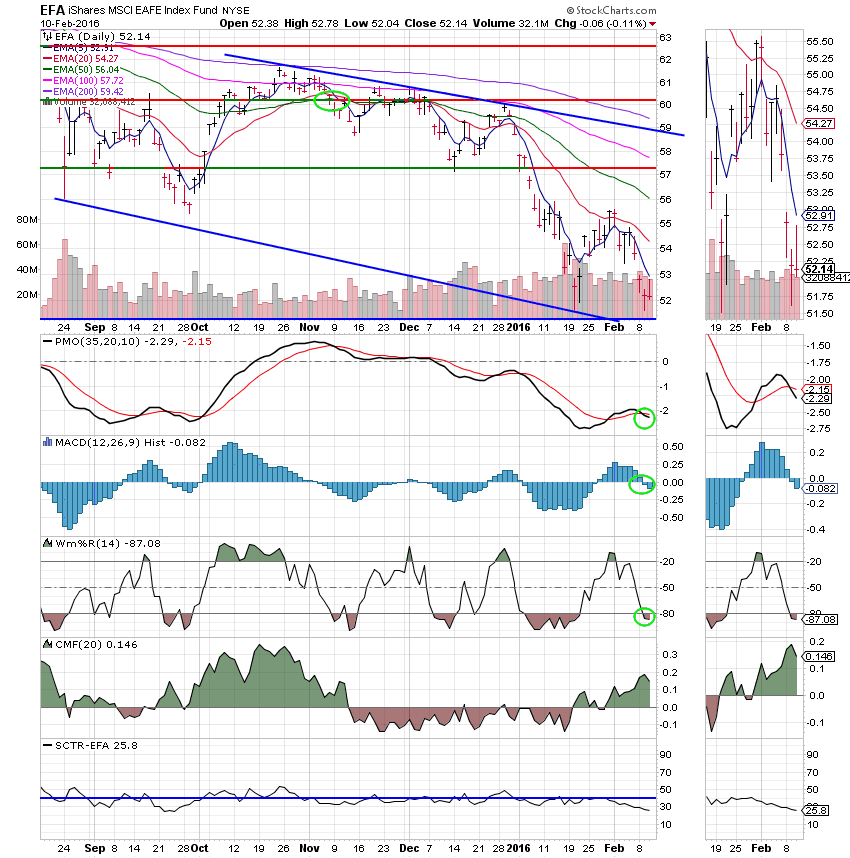
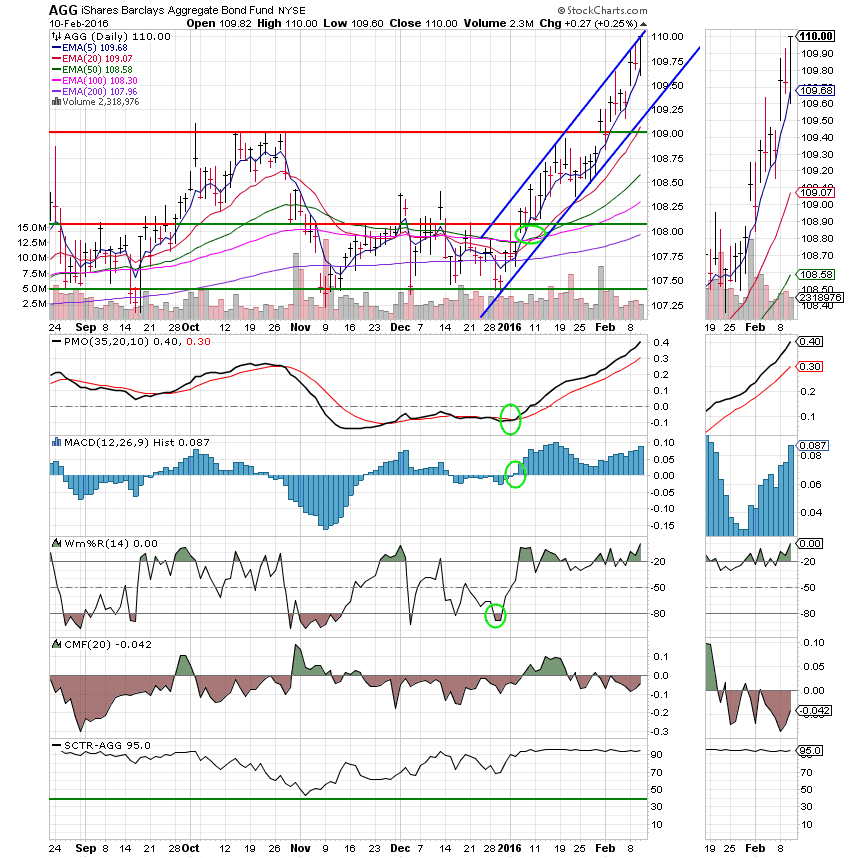
Lets take a look at the charts: (All signals annotated with Green Circles) If you click on the charts they will become larger! I’ve added a new indicator tonight. I replaced the Accumulation / Distribution Line with the Chaikin Money Flow (CMF) indicator. It tells us pretty much the same thing which is how much money is flowing into or out of a stock or fund. It is on a graduated scale with zero being neutral. Above zero indicates more buying. Below zero indicates more selling. It is a little easier to read. We’ll see if it helps with our analysis….
C Fund: The C Fund generated a sell signal when the PMO and MACD moved into negative configurations. Support is still holding at 185. So far so good with that, but it may not hold for long
S Fund:
I Fund:
F Fund: Folks, this fund is working great. I was going to change our allocation to 100/F from 100/G if Janet Yellen gave any indication that a rate hike was off in March. Unfortunately she did not. So we’ll stay in the G for now.
We remain in a bear market and our primary objective at this time is to preserve capital. If we keep our powder dry we’ll have plenty of fuel to propel us higher when the market finally turns up! That’s all for tonight. Have a great evening and may God continue to bless your trades.
God bless, Scott ![]()


