
Good Evening,
Another day of shifts. First it’s down, head to the safe havens, then here come the dip buyers and back to stocks. Stocks ended up saving the day ,although precious metals were back in the green as well. Bonds were off again, though not as bad as yesterday. Bonds in general suffered yesterday because of the economists estimates that today’s jobs report would be great and result in lower unemployment. It seems that the warped concept that most marker players employed was that the jobs report would cause the FED to increase interest rates sooner rather than later. Higher interest rates are bad for bonds! Well, surprise, surprise, the actual report badly undercut the estimates. So why, then, were bonds off today? Two reasons: the main reason is that stocks were back up again because bad news (in this case is good news). If the jobs report is bad then the FED won’t be raising the interest rates any time soon. Give me a break, why don’t they just wait until it happens and then deal with it? The second reason is that the bond money that wasn’t heading back to stocks was heading back to Europe where conditions were improving on the news that a cease fire was actually signed in Ukraine. Our TSP allocation continues to work well and though defensive in nature our AMP allocation also put together a gain for the day.
Here’s what RevShark had to say about it:
“It really doesn’t matter much what the reasons for the buying might be. It is a pattern that has persisted for quite some times. Very shallow pullbacks cause a little concern but before you know it the dip buyers show up and we act like there isn’t a worry in the world. If you are too bearish too fast or too long you end up as short squeeze fodder.”
S&P 500 ends at record as jobs report eases Fed worries
| 09/04/14 | |||||
| Fund | G Fund | F Fund | C Fund | S Fund | I Fund |
| Price | 14.5144 | 16.5145 | 26.1833 | 35.7536 | 26.4262 |
| $ Change | 0.0016 | -0.0269 | -0.0375 | -0.1383 | -0.0562 |
| % Change day | +0.01% | -0.16% | -0.14% | -0.39% | -0.21% |
| % Change week | +0.02% | -0.41% | -0.25% | -0.40% | +0.49% |
| % Change month | +0.02% | -0.41% | -0.25% | -0.40% | +0.49% |
| % Change year | +1.59% | +4.91% | +9.67% | +6.19% | +3.37% |
| L INC | L 2020 | L 2030 | L 2040 | L 2050 | |
| Price | 17.3192 | 22.8258 | 24.7589 | 26.3473 | 14.9834 |
| $ Change | -0.0124 | -0.0354 | -0.0457 | -0.0530 | -0.0314 |
| % Change day | -0.07% | -0.15% | -0.18% | -0.20% | -0.21% |
| % Change week | -0.05% | -0.08% | -0.10% | -0.10% | -0.09% |
| % Change month | -0.05% | -0.08% | -0.10% | -0.10% | -0.09% |
| % Change year | +2.99% | +4.73% | +5.54% | +6.09% | +6.54% |
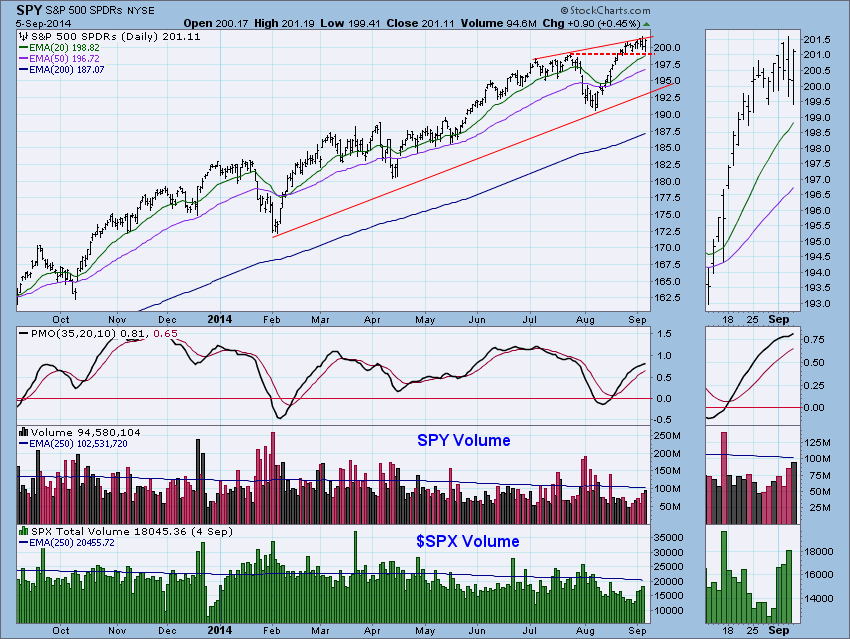
“Looking at today’s bar, we see that support and resistance held. So in technical terms, price was bounded no breakout, but no breakdown either. The PMO turned up which is positive in the shorter-term. Volume was healthy, though below the 250-EMA.”
“Another week with price testing resistance at the top of the rising trend channel and another week where resistance holds. “
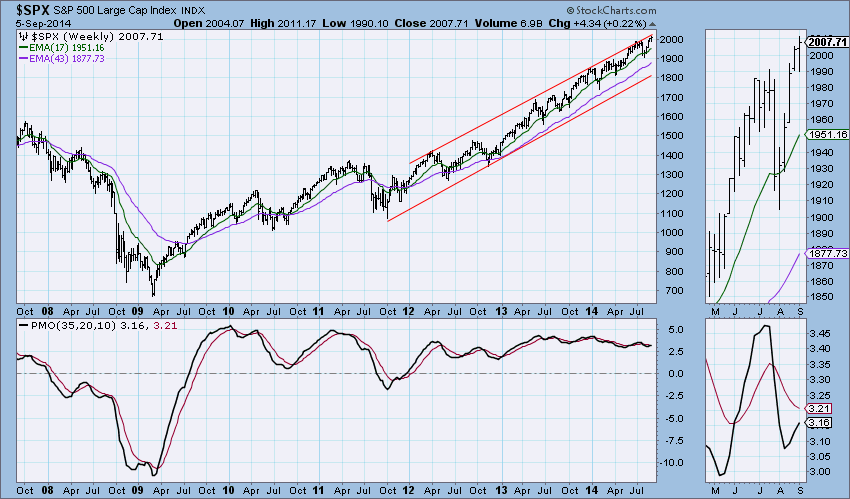
“Conclusion: Talking heads were really excited by today’s rally from lows, but technically price is still bounded by horizontal support at the July high and the rising trend. Ultra-short-term and short-term indicators are neutral to somewhat bullish. With intermediate-term indicators turning back up after brief and gentle tops, they can be considered bullish. With the market setting a new all-time closing high, the euphoria could continue after the weekend. But is it enough to get price to breakout?”