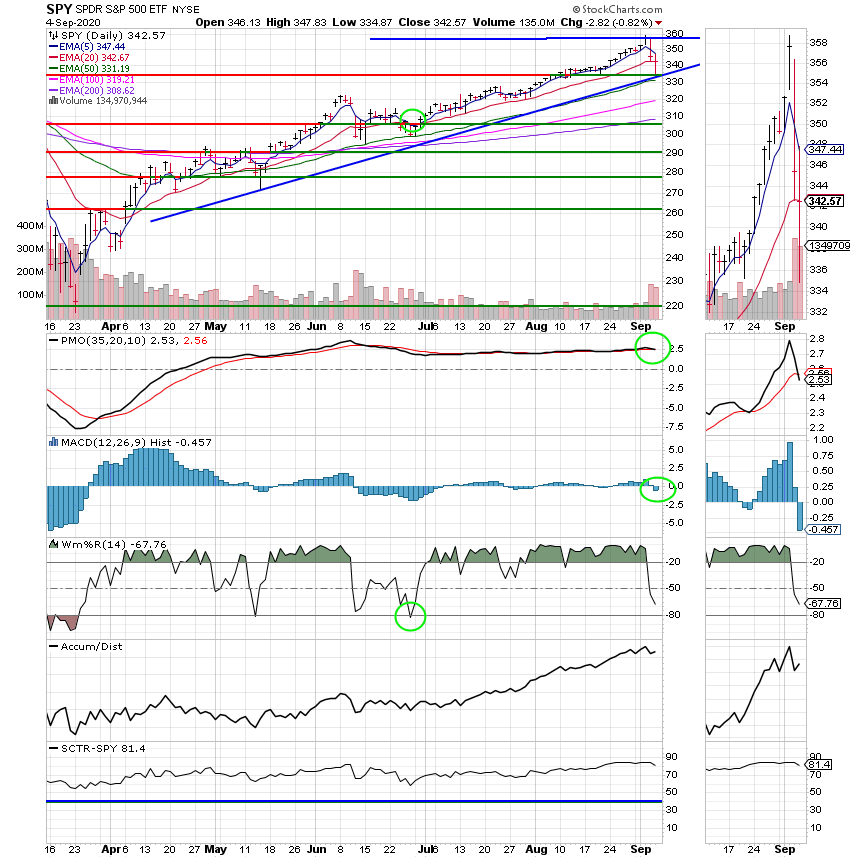
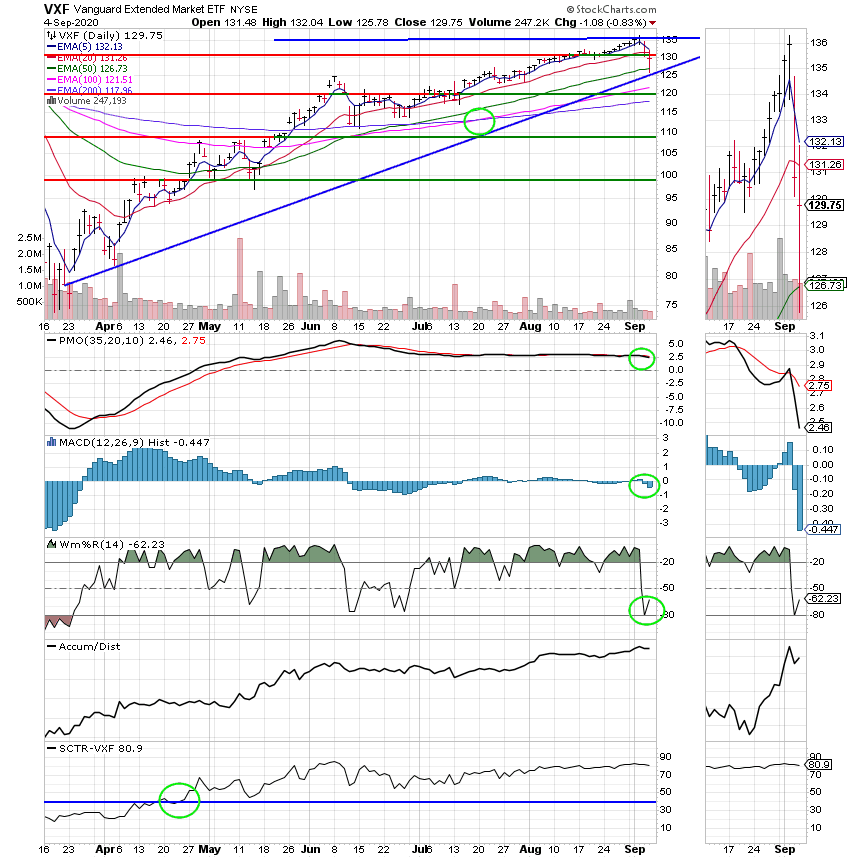
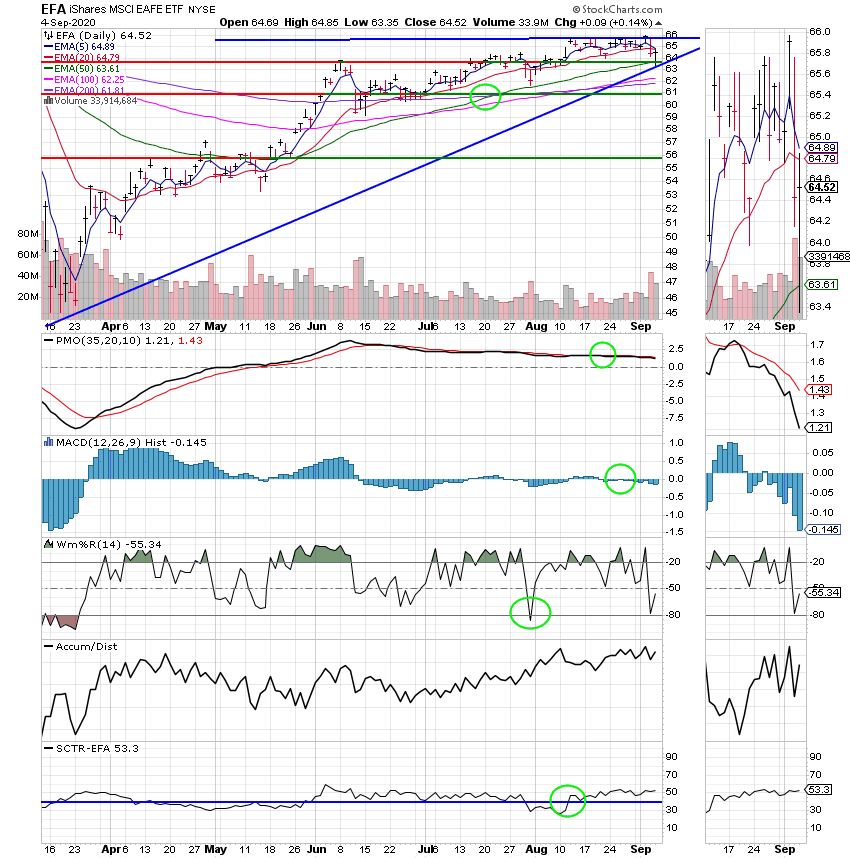
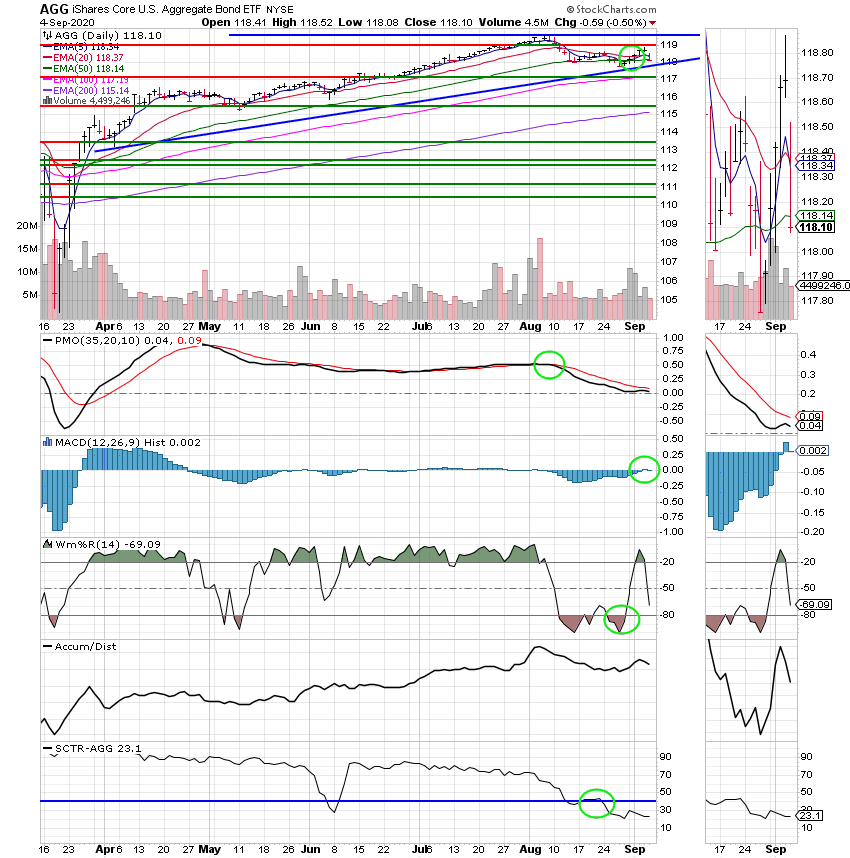
Good Evening, So tech finally sold off and it took the broader market along for the ride. The writers who have to write came up with a reason. They say the valuations have gotten too high on tech stocks. I agree with that just a little bit, but only a little. Stocks like Apple (AAPL) and Nvidia (NVDA) have a lot of potential for growth and if you don’t think so check out the last few reports for each company. The last time I checked, future earnings are part of the formula so I can only go so far with that media excuse because companies like these are going to make a lot of money. So tech got to hot? After a close look at the charts I felt like it was the redistribution of profits from the fantastic run in tech into stocks beaten up during the Covid 19 shutdown such as Airlines and Banks. This move powered a broader range of stocks into leadership which is exactly what this market needs if it is going to make a sustained move higher. A precious few tech stocks have fueled the rally heretofore and it’s now time for the broader market to participate. So you ask why did the market move lower if more stocks are participating in the rally??? Good question! The money to start buying the previously beaten down stocks is coming from mega cap tech stocks like Apple, Microsoft and Amazon. These are some of the largest corporations by market cap in the world so naturally when they sell off the market will go down. However, investors will only sell some of the profits from these great stocks, not all of the shares they own! Meanwhile, they will buy things like airlines, cruise ships and industrial corporations. When the tech stocks stop falling and the broader market continues to gain we will see the next leg up in this bull market. The only thing that has a chance to derail it is political unrest from the upcoming elections. A close look at the charts today revealed only consolidation and redistribution. I’m not selling a thing. You have to ask yourself when selling like this starts. Have the charts changed or has the reason I bought stocks changed? The answer to both is a resounding no!!! #1 The economy is improving. Don’t think so? Just look at today’s jobs report. Unemployment which was expected to drop to 9.4% fell all the way to 8.4%!!!! #2 Corporations are making money. Take a look at the corporate reports filed this earnings quarter and you will see that over 80% of them have beaten analyst expectations and some of them have beaten them badly. Can you say Zoom…..#3 Good report after good report continues to show progress in the battle against Covid 19. There is light at the end of the tunnel and we are going to not only survive. We are going to thrive!!!! No Sir/Maam. I am not selling anything and I wish I had the funds to purchase more…….
Today’s trading left us with the following results. Our TSP allocation fell -0.83%. For comparison, the Dow dropped -0.56%, the Nasdaq -1.27%, and the S&P 500 -0.81%.
The days action left us with the following signals: C-Neutral, S-Neutral, I-Neutral, F-Neutral. We are currently invested at 100/S. Our allocation is now +26.29% for the year not including the days results. Here are the latest posted results:
| 09/03/20 | Prior Prices | ||||
| Fund | G Fund | F Fund | C Fund | S Fund | I Fund |
| Price | 16.4661 | 21.1669 | 51.1753 | 58.6145 | 30.9329 |
| $ Change | 0.0003 | 0.0245 | -1.8518 | -2.3057 | -0.6054 |
| % Change day | +0.00% | +0.12% | -3.49% | -3.78% | -1.92% |
| % Change week | +0.01% | +0.77% | -1.46% | -2.25% | -1.18% |
| % Change month | +0.01% | +0.53% | -1.26% | -2.38% | -1.15% |
| % Change year | +0.71% | +7.35% | +8.28% | +4.16% | -5.45% |
| Fund | L INC | L 2025 | L 2030 | L 2035 | L 2040 |
| Price | 21.6104 | 10.474 | 35.8748 | 10.6239 | 39.6366 |
| $ Change | -0.1423 | -0.1587 | -0.6553 | -0.2131 | -0.8669 |
| % Change day | -0.65% | -1.49% | -1.79% | -1.97% | -2.14% |
| % Change week | -0.27% | -0.68% | -0.83% | -0.91% | -1.00% |
| % Change month | -0.26% | -0.65% | -0.79% | -0.87% | -0.95% |
| % Change year | +2.00% | +4.74% | +2.93% | +6.24% | +3.14% |
| Fund | L 2045 | L 2050 | L 2055 | L 2060 | L 2065 |
| Price | 10.7258 | 23.2113 | 10.9271 | 10.9272 | 10.9274 |
| $ Change | -0.2513 | -0.5802 | -0.3332 | -0.3332 | -0.3331 |
| % Change day | -2.29% | -2.44% | -2.96% | -2.96% | -2.96% |
| % Change week | -1.07% | -1.15% | -1.47% | -1.47% | -1.47% |
| % Change month | -1.02% | -1.10% | -1.38% | -1.38% | -1.38% |
| % Change year | +7.26% | +3.24% | +9.27% | +9.27% | +9.27% |