2021 Analysis From Wayne

Good Day,
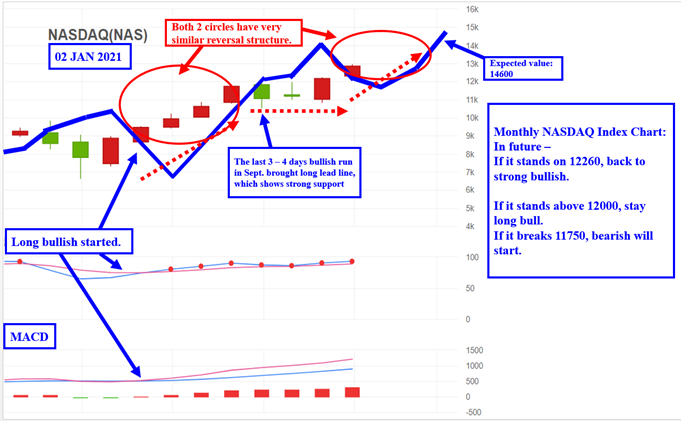
                   These are the Monthly/Weekly/Daily charts. Since NASDAQ, S&P500, and SOXX semiconductor indices are still bullish, S fund should continue bullish trend after a week consolidation.
Above, the monthly reversal line shows the uptrend will continue to at least till next February/March time frame.
Both 2 red circles have very similar bullish structures.
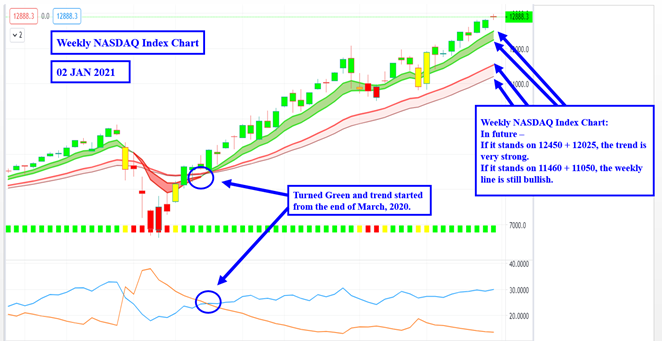
Above is the Weekly NASDAQ Index Chart:
In future –
If it stands on 12450 + 12025, the trend is very strong.

If it stands on 11460 + 11050, the weekly line is still bullish.
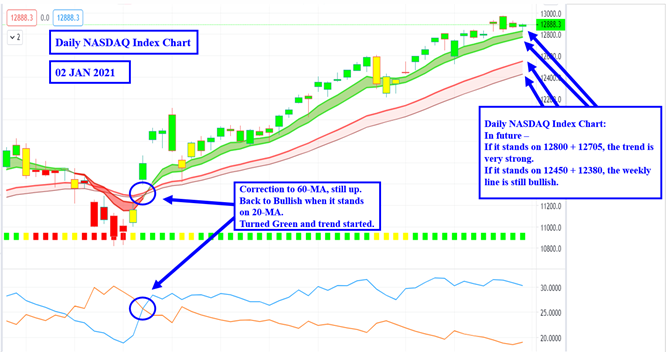

Above is the Daily NASDAQ Index Chart:
In future –
If it stands on 12800 + 12705, the trend is very strong.

If it stands on 12450 + 12380, the weekly line is still bullish.

Have a nice day, Wayne


  • 04/29/2024

    Good Morning, One more trading day and this month is over. My how time is flying. The big question at least for our newer members is “Are we getting back in this week?” As with most market questions that is a loaded question. There is much much more to it than the fact that the…


  • 04/22/2024

    Good Morning, I decided to go ahead and get this blog out of the way because there is so much turmoil in the market this morning. Wow, what a week it was. It seems like a month passed by. It was just a little over a week ago when the market was flying high and…


  • 04/15/2024

    Good Evening, Wow, where do I start tonight? First let me talk briefly about last Thursday’s interfund transfer. We issued the transfer alert at 11:00 AM  that day and there were several folks that didn’t see it in time to make the trade before the TSP deadline of 12:00PM. Given the next days drop their…