
Good Afternoon, Last week we got shelled out of equities again. This was the third time we entered the market based on our short term indicators. These were the same indicators that we had used to get back into the market after a sell offs for the past 30 years. So what gives??? I had to do quite a bit of work looking at more than a few charts but I eventually got to the bottom of what I think is the problem. We have talked many times about high speed algorithms trading and how after 2008 it was developed to take advantage of fundamental issues in the market sucking investors in before reversing and leaving them holding the bag. The folks that programed these algo’s started making big money using this tactic about the same time as the financial crisis in 2009. It took me a long time to figure that one out when it was happening but I finally did. I underperformed the market for a few years after they started using this tactic, but I finally discovered it because they were moving so much money you could see their footprint in the volume. It was clear every time the market reversed. It would start down after market moving news and then abruptly reverse after dropping a few percentage points. Usually less than five. Never before had we seen this type of action. It was baffling, but we finally figured it out. You see the market wasn’t dropping initially because investors were selling. It was dropping because the high speed algorithms were kicking in, but investors believed that it was other investors selling and followed suit at which time the highspeed algorithms scooped up stocks that were sold at a discount and made a profit. Then they would simply rinse and repeat on the next fundamental issue. This is how they made their money and they made a lot of it! You can think of it as legal market manipulation because that is exactly what it is. They move a large volume of money and cause the market to move in whatever direction they desire in order to fake out uninformed investors. It worked then and still works now, but the computer masters wanted more. So now they have come up with a new strategy on top of the deceitful practices they were already using. They are now programing their machines to move the market based on certain technical signals on the charts. They realized that a lot of investors were using technical analysis to make their market decisions and wanted to take advantage of it. So how do they do it?? They wait until the market is close to breaking a technical barrier such as say the 5EMA crossing up through the 50EMA after a sell off then buy and move the market higher, prompting investors to buy into the market thinking a bottom is in and the market is moving higher. They then program the algorithms to sell after the market moves a few points higher. Again usually around five points. They make a profit every time they push the market up or down this way depending on whether the market is in a downtrend or an uptrend. I think the practice should be outlawed by the SEC but who am I? At any rate I’ve got them figure out for now. All we can do is use long term indicators as the short to intermediate term indicators have been all but rendered ineffective by their algorithms. What does that mean?? We will have to wait and watch longer in order to tell if it’s a legitimate up trend or simply more market manipulation. All this while folks will be jumping in and saying they told us so. Those same folks will be and have been wrong many times before they will be right, but to outperform the market from this point forward you must be even more disciplined than ever and not cave into their peer pressure. You must reenter the market only when you are ready to do so based on your long term indicators. Folks, you have to lay off the short stuff. You are at some time going to have to watch some investors make a few nice gains before you buy back in. Otherwise you risk being caught in yet another reversal. Fool me once it’s not my fault but fool me twice and it is…. We are already 25% in the hole and you know what they say….. If you don’t want to get deeper then quit digging. Keep your eye’s on your account and off of other investors. Don’t worry about what you could be making of what you feel like you are losing. That will only lead you to more pain and disappointment. Do what you know you have to do to reduce risk and keep your account moving higher. After you retire or when you finally spend the money you will be glad you did.
The days trading is producing the following results: As of the writing of this blog our TSP allotment is steady in the G Fund. For comparison, The Dow is up +2.13%, the Nasdaq +2.70%, and the S&P 500 +2.52%. For the record I think today’s action is no more than a dead cat bounce….
S&P 500 jumps 2.6%, rebounding from worst week of the bear market
Recent action has generated the following signals: C-Sell, S-Sell, I-Sell, F-Sell. We are currently invested at 100/G. Our allocation is now -25.20% for the year not including the days results. Here are the latest posted results
| Date | L Income | L 2025 | L 2030 | L 2035 | L 2040 | L 2045 | L 2050 | L 2055 | L 2060 | L 2065 | G Fund | F Fund | C Fund | S Fund | I Fund |
|---|---|---|---|---|---|---|---|---|---|---|---|---|---|---|---|
| Jun 17, 2022 | $22.1865 | $11.0196 | $37.3676 | $11.0664 | $41.3192 | $11.1800 | $24.2179 | $11.5506 | $11.5496 | $11.5484 | $16.9104 | $18.5454 | $55.8824 | $58.8459 | $31.4971 |
| Jun 16, 2022 | $22.1819 | $11.0161 | $37.3510 | $11.0609 | $41.2960 | $11.1728 | $24.2010 | $11.5410 | $11.5400 | $11.5388 | $16.9091 | $18.5406 | $55.7585 | $57.9256 | $31.7257 |
| Jun 15, 2022 | $22.3370 | $11.1545 | $38.0299 | $11.2819 | $42.1965 | $11.4343 | $24.8059 | $11.8943 | $11.8933 | $11.8920 | $16.9077 | $18.4974 | $57.6268 | $60.9049 | $32.3304 |
| Jun 14, 2022 | $22.2347 | $11.0697 | $37.6271 | $11.1507 | $41.6649 | $11.2803 | $24.4521 | $11.7004 | $11.6993 | $11.6980 | $16.9063 | $18.3005 | $56.7962 | $59.8312 | $31.7231 |
| Jun 13, 2022 | $22.2697 | $11.0987 | $37.7652 | $11.1960 | $41.8486 | $11.3336 | $24.5746 | $11.7654 | $11.7644 | $11.7631 | $16.9049 | $18.4131 | $56.9910 | $60.0195 | $32.0306 |
| Jun 10, 2022 | $22.4903 | $11.2904 | $38.7021 | $11.5027 | $43.1007 | $11.6984 | $25.4179 | $12.2420 | $12.2410 | $12.2398 | $16.9007 | $18.7146 | $59.2895 | $63.3804 | $33.1670 |
| Jun 9, 2022 | $22.6450 | $11.4259 | $39.3679 | $11.7208 | $43.9914 | $11.9579 | $26.0186 | $12.5862 | $12.5853 | $12.5841 | $16.8993 | $18.8678 | $61.0648 | $65.4936 | $33.9659 |
| Jun 8, 2022 | $22.7689 | $11.5374 | $39.9231 | $11.9026 | $44.7359 | $12.1748 | $26.5225 | $12.8824 | $12.8815 | $12.8804 | $16.8979 | $18.8810 | $62.5482 | $67.1999 | $34.7167 |
| Jun 7, 2022 | $22.8345 | $11.5955 | $40.2102 | $11.9967 | $45.1207 | $12.2870 | $26.7825 | $13.0322 | $13.0313 | $13.0302 | $16.8965 | $18.9368 | $63.2282 | $68.0360 | $35.1567 |
| Jun 6, 2022 | $22.7878 | $11.5555 | $40.0158 | $11.9331 | $44.8609 | $12.2113 | $26.6072 | $12.9326 | $12.9316 | $12.9305 | $16.8951 | $18.8812 | $62.6296 | $67.0526 | $35.0752 |
| Jun 3, 2022 | $22.7717 | $11.5403 | $39.9383 | $11.9081 | $44.7585 | $12.1816 | $26.5375 | $12.8846 | $12.8837 | $12.8826 | $16.8909 | $18.9998 | $62.4331 | $66.8090 | $34.9084 |
| Jun 2, 2022 | $22.8540 | $11.6139 | $40.3025 | $12.0272 | $45.2454 | $12.3233 | $26.8658 | $13.0758 | $13.0749 | $13.0739 | $16.8895 | $19.0289 | $63.4662 | $67.7078 | $35.3755 |
| Jun 1, 2022 | $22.7440 | $11.5166 | $39.8222 | $11.8701 | $44.6027 | $12.1359 | $26.4311 | $12.8221 | $12.8212 | $12.8202 | $16.8881 | $19.0073 | $62.3072 | $65.7420 | $34.7558 |
| May 26, 2022 | $22.7139 | $11.4906 | $39.6951 | $11.8294 | $44.4375 | $12.0885 | $26.3208 | $12.7499 | $12.7491 | $12.7482 | $16.8797 | $19.1524 | $61.6252 | $65.3406 | $34.8302 |
| May 25, 2022 | $22.6163 | $11.4047 | $39.2730 | $11.6917 | $43.8752 | $11.9249 | $25.9420 | $12.5294 | $12.5286 | $12.5276 | $16.8784 | $19.1400 | $60.4217 | $63.7477 | $34.4312 |
| May 24, 2022 | $22.5706 | $11.3658 | $39.0847 | $11.6300 | $43.6231 | $11.8513 | $25.7714 | $12.4333 | $12.4325 | $12.4315 | $16.8770 | $19.0763 | $59.8551 | $62.3455 | $34.4516 |
| May 23, 2022 | $22.6037 | $11.3995 | $39.2599 | $11.6874 | $43.8601 | $11.9207 | $25.9344 | $12.5368 | $12.5359 | $12.5348 | $16.8757 | $18.9370 | $60.3446 | $63.8646 | $34.5341 |
| May 20, 2022 | $22.5130 | $11.3194 | $38.8666 | $11.5596 | $43.3398 | $11.7701 | $25.5858 | $12.3294 | $12.3286 | $12.3276 | $16.8715 | $19.0127 | $59.2382 | $63.2517 | $33.9360 |
| May 19, 2022 | $22.4943 | $11.3051 | $38.8006 | $11.5381 | $43.2533 | $11.7451 | $25.5287 | $12.3000 | $12.2991 | $12.2981 | $16.8702 | $18.9486 | $59.2289 | $63.3279 | $33.6967 |
| May 18, 2022 | $22.4887 | $11.3014 | $38.7850 | $11.5328 | $43.2314 | $11.7384 | $25.5130 | $12.2932 | $12.2924 | $12.2913 | $16.8688 | $18.9077 | $59.5705 | $62.8981 | $33.4677 |
| May 17, 2022 | $22.6638 | $11.4596 | $39.5698 | $11.7890 | $44.2777 | $12.0425 | $26.2183 | $12.7102 | $12.7093 | $12.7081 | $16.8675 | $18.8321 | $62.0640 | $65.3946 | $34.1818 |
| May 16, 2022 | $22.5591 | $11.3643 | $39.0951 | $11.6340 | $43.6438 | $11.8580 | $25.7895 | $12.4530 | $12.4521 | $12.4510 | $16.8661 | $18.9392 | $60.8333 | $63.5527 | $33.5600 |
| May 13, 2022 | $22.5691 | $11.3763 | $39.1605 | $11.6558 | $43.7344 | $11.8848 | $25.8527 | $12.4925 | $12.4916 | $12.4905 | $16.8620 | $18.8997 | $61.0708 | $64.3532 | $33.5037 |
| May 12, 2022 | $22.4302 | $11.2519 | $38.5457 | $11.4552 | $42.9151 | $11.6464 | $25.2998 | $12.1662 | $12.1654 | $12.1644 | $16.8606 | $18.9728 | $59.6403 | $61.8231 | $32.6619 |
| May 11, 2022 | $22.4268 | $11.2498 | $38.5374 | $11.4523 | $42.9026 | $11.6423 | $25.2901 | $12.1622 | $12.1614 | $12.1603 | $16.8593 | $18.9435 | $59.6964 | $60.9568 | $32.7775 |
| May 10, 2022 | $22.4918 | $11.3104 | $38.8412 | $11.5515 | $43.3092 | $11.7608 | $25.5657 | $12.3281 | $12.3272 | $12.3261 | $16.8579 | $18.8625 | $60.6936 | $62.5908 | $32.9225 |
| May 9, 2022 | $22.4696 | $11.2924 | $38.7563 | $11.5239 | $43.1973 | $11.7284 | $25.4914 | $12.2874 | $12.2865 | $12.2854 | $16.8566 | $18.8152 | $60.5448 | $62.6524 | $32.7154 |
| May 6, 2022 | $22.6356 | $11.4454 | $39.5243 | $11.7756 | $44.2296 | $12.0298 | $26.1927 | $12.7057 | $12.7047 | $12.7035 | $16.8524 | $18.7320 | $62.5443 | $65.9830 | $33.6609 |
| May 5, 2022 | $22.6913 | $11.4947 | $39.7696 | $11.8564 | $44.5619 | $12.1274 | $26.4196 | $12.8356 | $12.8347 | $12.8335 | $16.8511 | $18.8048 | $62.8922 | $67.4491 | $34.0766 |
| May 4, 2022 | $22.8893 | $11.6694 | $40.6319 | $12.1390 | $45.7180 | $12.4646 | $27.2014 | $13.2874 | $13.2865 | $13.2854 | $16.8497 | $18.9555 | $65.2099 | $70.6061 | $35.0620 |
| May 3, 2022 | $22.7500 | $11.5478 | $40.0344 | $11.9436 | $44.9201 | $12.2324 | $26.6638 | $12.9768 | $12.9759 | $12.9747 | $16.8484 | $18.8602 | $63.3185 | $68.7905 | $34.5440 |
| May 2, 2022 | $22.7172 | $11.5199 | $39.8992 | $11.8995 | $44.7403 | $12.1802 | $26.5431 | $12.9080 | $12.9071 | $12.9059 | $16.8470 | $18.8255 | $63.0136 | $68.5319 | $34.3100 |
| Apr 29, 2022 | $22.7054 | $11.5076 | $39.8339 | $11.8783 | $44.6523 | $12.1544 | $26.4819 | $12.8650 | $12.8641 | $12.8631 | $16.8448 | $18.9388 | $62.6578 | $67.7322 | $34.4199 |
| Apr 28, 2022 | $22.8533 | $11.6388 | $40.4826 | $12.0907 | $45.5206 | $12.4072 | $27.0679 | $13.2042 | $13.2033 | $13.2023 | $16.8425 | $19.0361 | $65.0123 | $69.9058 | $34.7230 |
| Apr 27, 2022 | $22.7450 | $11.5419 | $40.0017 | $11.9335 | $44.8780 | $12.2203 | $26.6340 | $12.9477 | $12.9469 | $12.9459 | $16.8413 | $19.0589 | $63.4384 | $68.4896 | $34.2827 |
| Apr 26, 2022 | $22.7360 | $11.5329 | $39.9550 | $11.9185 | $44.8162 | $12.2025 | $26.5922 | $12.9191 | $12.9183 | $12.9173 | $16.8402 | $19.1244 | $63.3047 | $68.6538 | $34.1334 |
| Apr 25, 2022 | $22.8825 | $11.6675 | $40.6326 | $12.1406 | $45.7280 | $12.4687 | $27.2122 | $13.2913 | $13.2904 | $13.2894 | $16.8391 | $19.0399 | $65.1375 | $71.0661 | $35.0508 |
| 06/17/22 | Prior Prices | ||||
| Fund | G Fund | F Fund | C Fund | S Fund | I Fund |
| Price | 16.9104 | 18.5454 | 55.8824 | 58.8459 | 31.4971 |
| $ Change | 0.0013 | 0.0048 | 0.1239 | 0.9203 | -0.2286 |
| % Change day | +0.01% | +0.03% | +0.22% | +1.59% | -0.72% |
| % Change week | +0.06% | -0.90% | -5.75% | -7.15% | -5.03% |
| % Change month | +0.18% | -3.17% | -9.32% | -9.94% | -9.57% |
| % Change year | +1.04% | -11.21% | -22.33% | -29.48% | -20.14% |
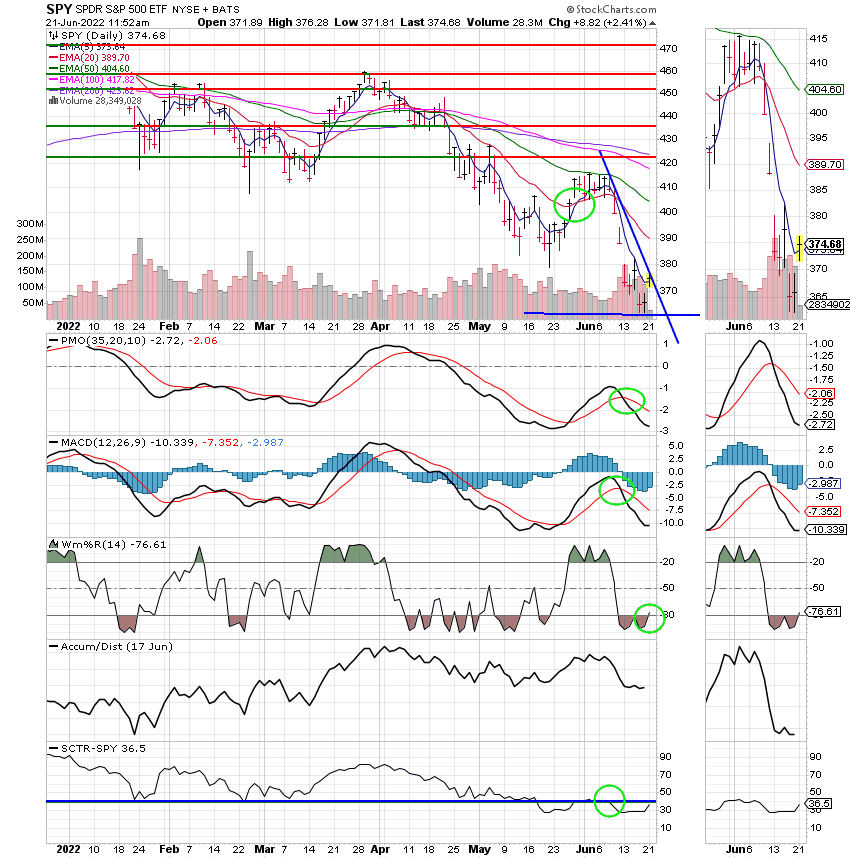
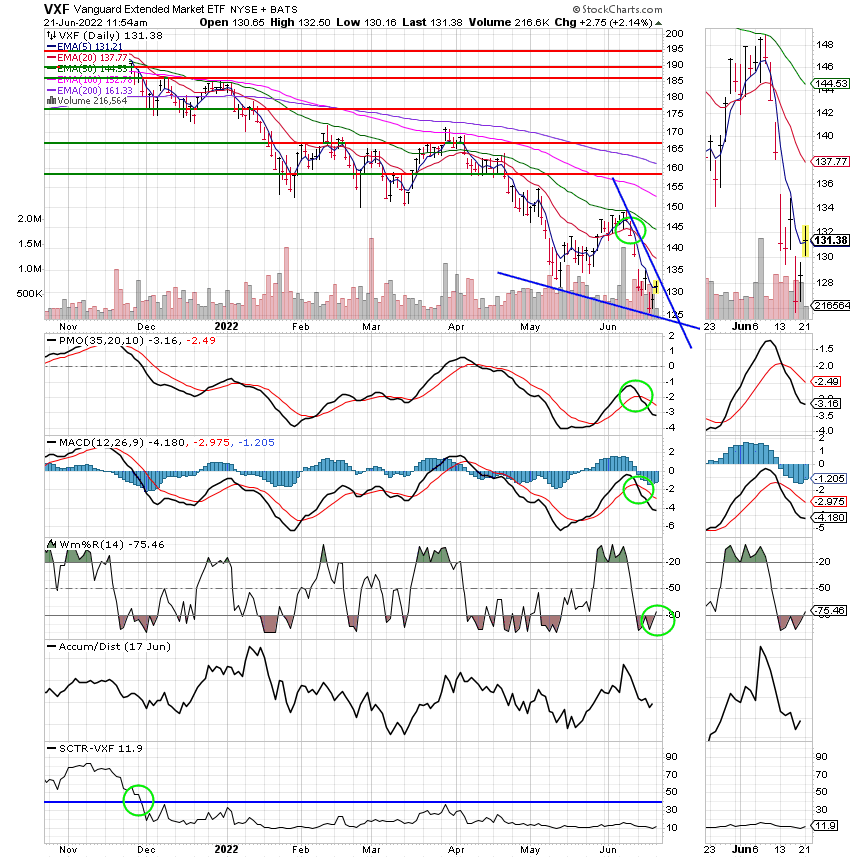
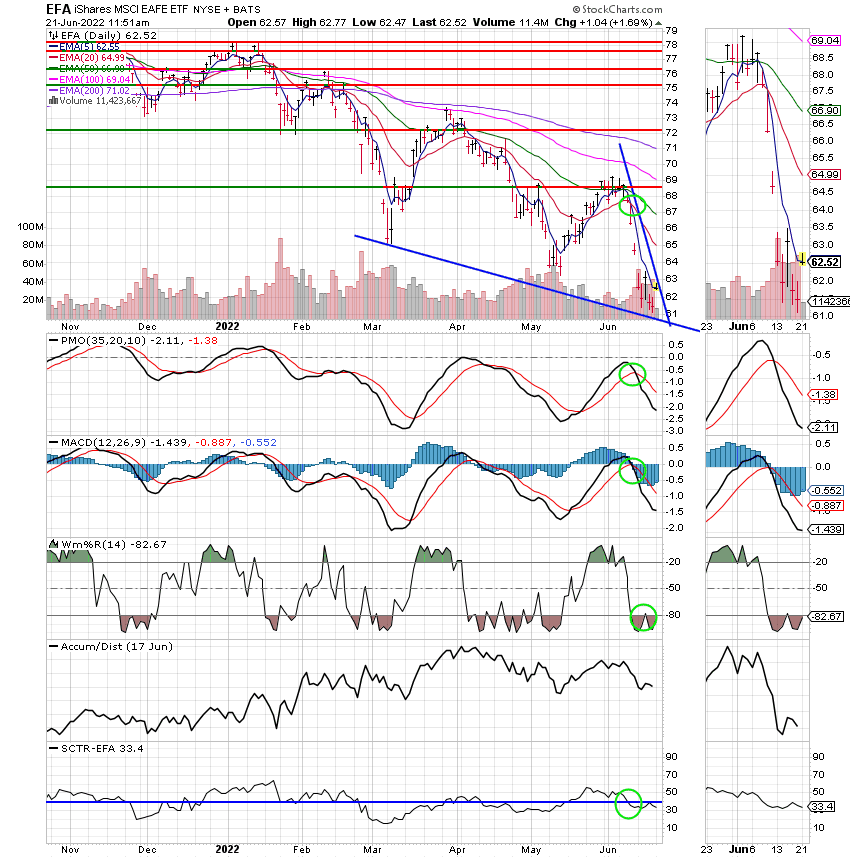
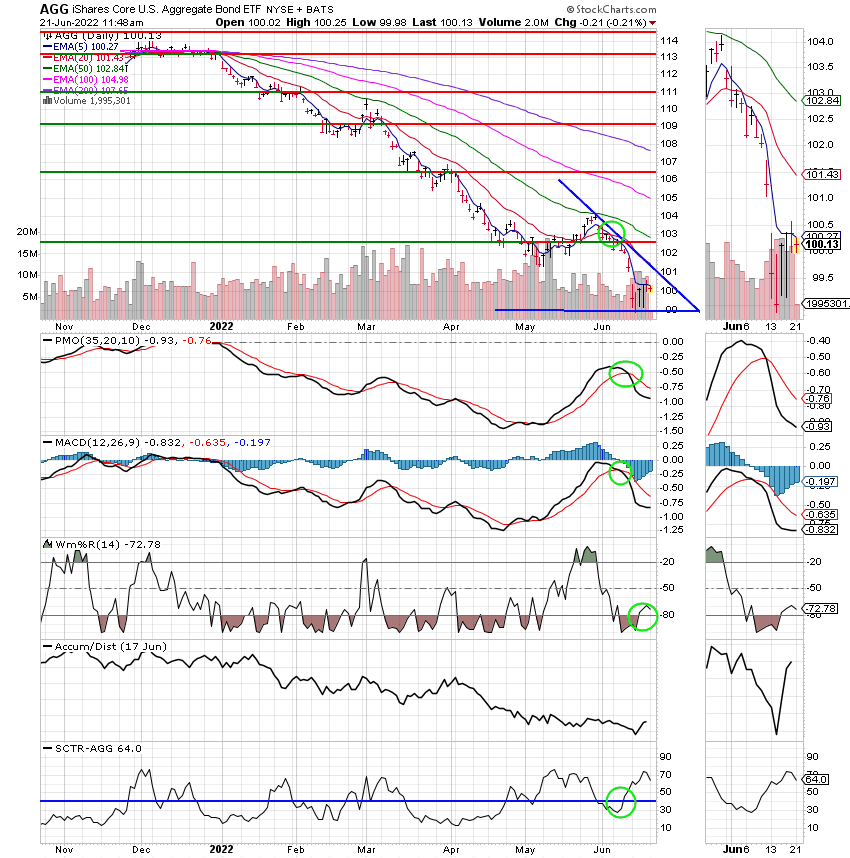
Now lets take a look at the charts. All signals are annotated with green circles. If you click on the charts they will become larger. If you want to learn more about technical analysis check out the website StockCharts.com.
C Fund:
S Fund:
The I Fund:
The F Fund:
I look for the action to continue to be volatile for the foreseeable future. So keep praying and praising! That’s all for today. Have a nice day and may God continue to bless your trades!!
God bless, Scott ![]()
***Just a reminder that you can review the performance of our allocation at the Web Site TSPTALK.com in the autotracker section under the screen name KyFan1.
I produce and publish this blog as both a ministry and for the benefit of any Federal Government Employee. This is done to offer you some guidance as to how to approach your retirement more financially successful. When it is time for you to retire, I recommend you utilize the services of a Professional Money Manager, who works with a reputable investment firm. He understands the guidance you have already received and he can manage your savings assets utilizing a more advanced investment program into the future. If you would like to receive more information about this introduction, please feel free to contact me at KyFan1@aol.com.