
Good Day, Just to keep you all up to date, they are still working on the website. So, it will be up and down. We have a major firm working on it now. Eventually it will be everything we all need it to be. We just need to be patient right now while they straighten out such issues as the domain and rebuilding the apps. Suffice to say someone left our previous web host and when they did our account went into a black hole. So basically, nothing was done with it during that time. It’s a miracle that it functioned at all. That noted, it will be a while yet before they are able to fix all the problems. They must still obtain information from the previous firm in order to move forward. That is what is dragging the process out so much longer than it should be.
We continue to have the same dynamics shaping the market. Inflation and interest rates. Market players continue to assess each piece of news in order to determine what the Feds next move will be. Will it make the Fed continue to increase rates and if so how long or….. will it cause the Fed to pause the rate hikes. Also, they are looking for clues as to what they terminal rate will be and how long it might be before they start to decrease and normalize rates. As I mentioned last week they are obsessed with trying to predict the future. I wish them luck. We will continue to do what we do and react to the action we see before us on our charts.
Right now, we remain invested at 100/S. last week the small cap midcap blend briefly took over as the best of our TSP Funds. However, the market reversed after several quarterly reports missed expectations and issued poor guidance moving forward. As a result, the S Fund slipped with it. It was the worst week for stocks since last year. One important thing to keep in mind. We said before we ever reinvested in equities that the market would remain volatile until the Fed brought the rate of inflation back down to their target of 2 percent. So it should not come as a surprise to any of you when the market sells off on news like this. It should also be of no surprise that corporate reports and guidance are slowing down. After all, the Fed is in fact trying to slow the economy down. Instead of panicking when the things slow down we should be cautiously optimistic. The fact is that the economy will have to slow down before inflation is bought down. I see this as a good thing. It also see it as a good thing that jobs and consumer demand remain reasonably high. That tells us that the Fed may be able to bring inflation down without a full on recession (what they refer to as a soft landing). It appears to me that everything is moving in the right direction. We just need to be patient and stay the course. There is no reason to sell at this time. The main trend remains higher. The problem that a lot of folks have with it is that it is not moving straight up as it did the past twelve years. Not to beat a dead horse to death, but I said then and I’ll say if again now. That was not normal. While a decade seems like a long time to some of you younger folks it is a drop in the bucket compared to the amount of time that the market has been trading. Unprecedented Federal stimulus made that market go up. It was a result of out and out manipulation. That money is gone and things are now back to normal. This is the way things work. Don’t lose sight of the forest for the trees. The forest is the general trend. The trees are the volatility. If you get upset and jerk your money out every time the market moves lower you will underperform the market if not out and out lose. The high sped algorithm traders will Eat your lunch and make a lot of money off your losses. You need to remain firmly focused on the main trend and they only way you can see that is by observing a long term chart. So Scott does that mean we should just buy and hold? I thought you didn’t like that?? Your absolutely right!!! I hate buying and holding. I’ll borrow a phrase from our good friend Tom Crowley at TSPTalk.com (a great site by the way) Friends don’t let friends buy and hold. What we are doing is not buying and holding. We are remaining invested through the volatility as long as the trend continues to move higher. There are a lot of things we look at on the charts that tell us about this. Mainly however, we watch the lower trend line and the EMS’s (Exponential moving averages). When we see that these are broken we look to our many other indictors to confirm that the trend is down (lower highs and lower lows) and if that is the case, we sell. We then watch our charts to determine when that l downward trend is broken and becomes a uptrend once again. At that point we buy back into equites. Folks, this is not rocket science!! Anybody can do it if they have the time and put forth the effort. It’s simple, when the market is going higher we want to be in it. When it is going lower we want to be out. It is not market timing. We could care less about what the timeline is!!! The only thing we care about is if we are in the right place for the current intermediate to long term trend. Another easy way to understand this is to compare it to looking at a map for a long trip that you are planning. When you look at the map you can see the whole route. You can see when you turn in the wrong direction and when you turn back in the right direction. Most importantly you can tell when you are totally going the wrong way!!! When that happens you stop and turn around. Market volatility is easy to see on your charts. You can tell the general direction that your moving in and if you are moving in the wrong direction resulting in the need to sell in order to change directions and stay on the route to your destination which is a profit! The bottom line is that you don’t go anywhere without a map or a compass. That is your chart!!!!
The days trading so far has left us with the following results: Our TSP allotment is currently slipping -0.25%. For comparison, the Dow is off -0.74%, the Nasdaq -0.36%, and the S&P 500 -0.53%.
Stocks climb, reverse losses as traders digest January’s inflation report.
Recent action has left us with the following signals: C-Buy, S-Buy, I-Hold, F-Sell. Our allocation is now +6.03% for the year not including the days results. Here are the latest posted results:
| 02/13/23 | Prior Prices | ||||
| Fund | G Fund | F Fund | C Fund | S Fund | I Fund |
| Price | 17.316 | 18.5665 | 63.5815 | 68.6076 | 36.7024 |
| $ Change | 0.0052 | 0.0463 | 0.7290 | 0.7991 | 0.3168 |
| % Change day | +0.03% | +0.25% | +1.16% | +1.18% | +0.87% |
| % Change week | +0.03% | +0.25% | +1.16% | +1.18% | +0.87% |
| % Change month | +0.13% | -1.24% | +1.56% | +0.61% | -0.28% |
| % Change year | +0.47% | +1.97% | +7.94% | +11.50% | +8.13% |
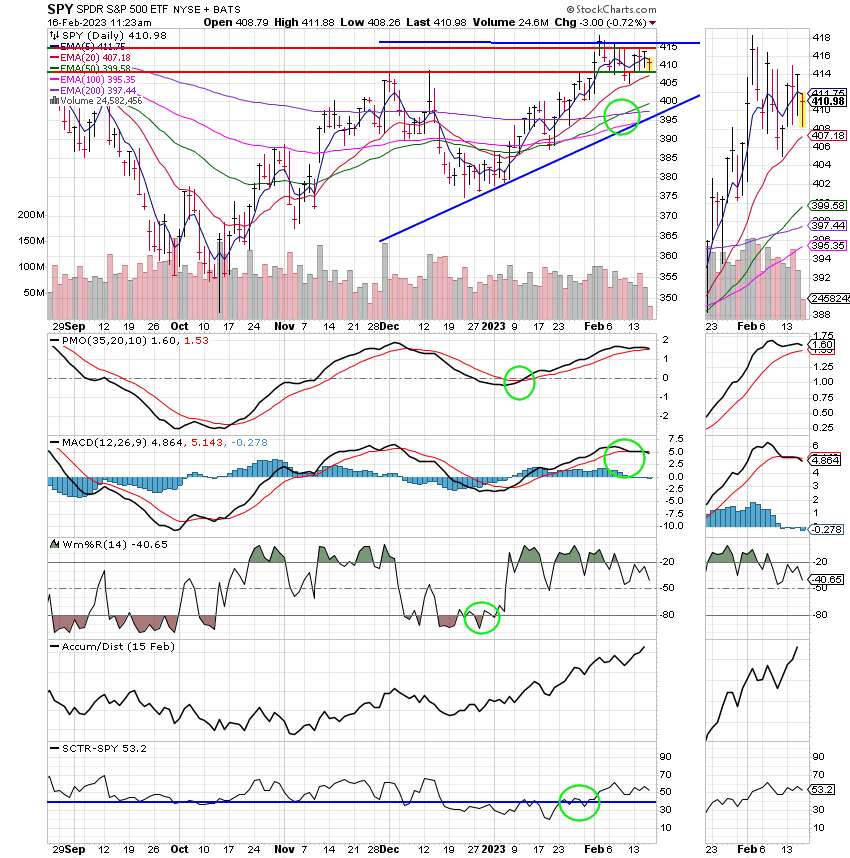
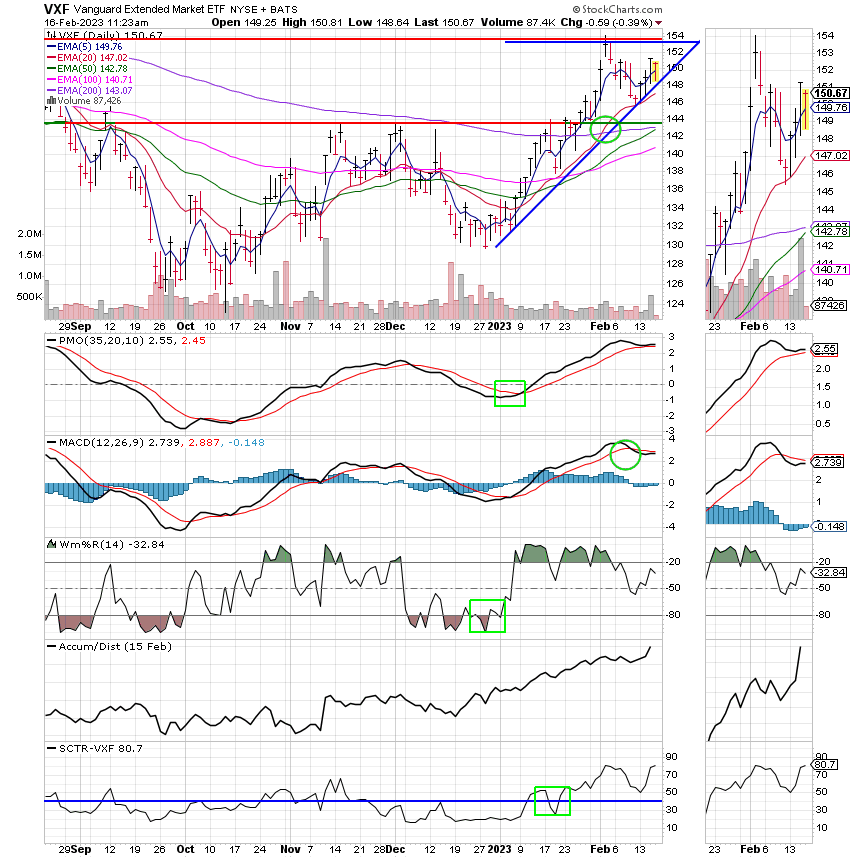
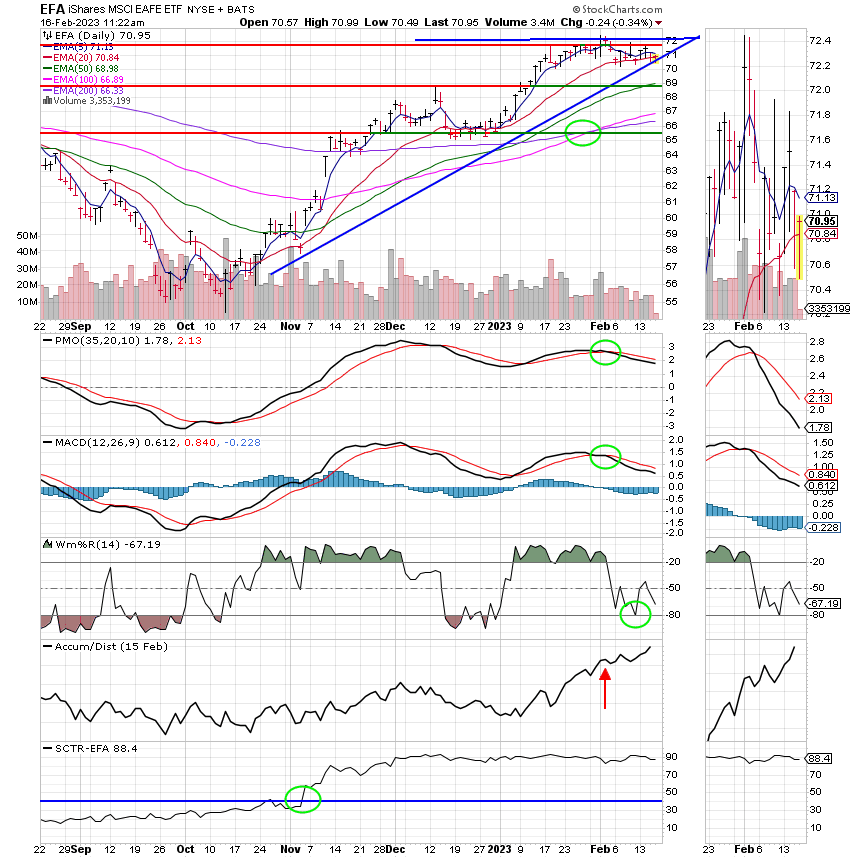
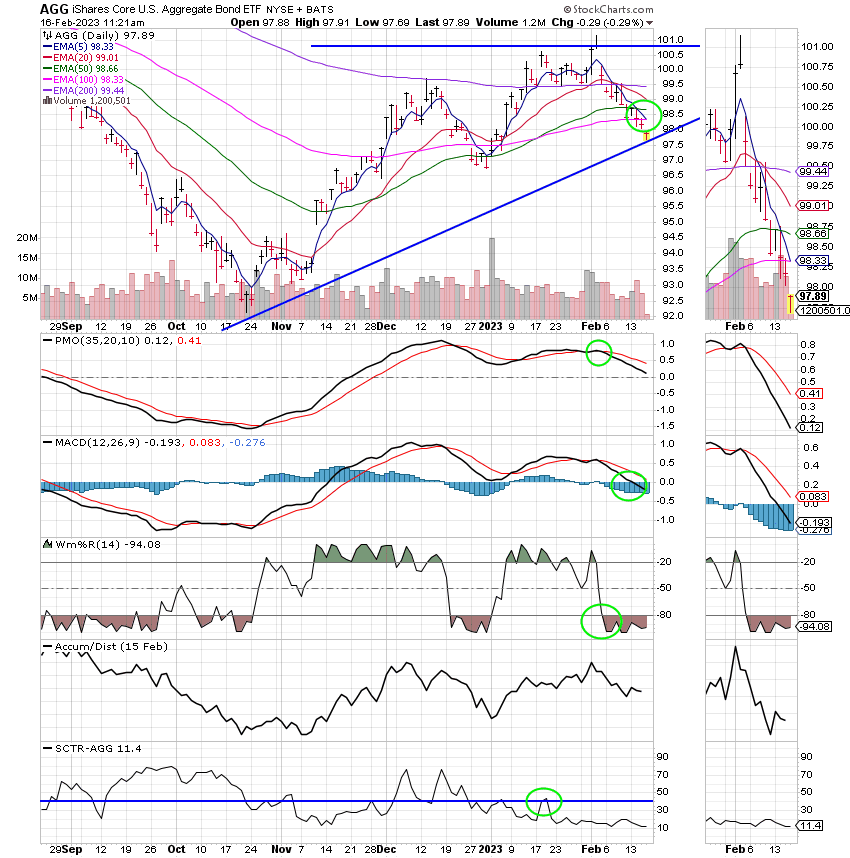
Now lets take a look at the charts. All signals are annotated with green circles. If you click on the charts they will become larger. If you want to learn more about technical analysis check out the website StockCharts.com.
C Fund:
S Fund:
I Fund:
F Fund:
I know this blog is in a little different format than usual but I just have to do the best that I can do until they get everything reconstructed. I must say though that I’m very excited about the end product and I’m sure you will be too. That’s all for today! Keep a close eye on your charts!! Have a nice afternoon and may God continue to bless your tades!
God bless, Scott
***Just a reminder that you can review the performance of our allocation at the Web Site TSPTALK.com in the autotracker section under the screen name KyFan1.
I produce and publish this blog as both a ministry and for the benefit of any Federal Government Employee. This is done to offer you some guidance as to how to approach your retirement more financially successful. When it is time for you to retire, I recommend you utilize the services of a Professional Money Manager, who works with a reputable investment firm. He understands the guidance you have already received and he can manage your savings assets utilizing a more advanced investment program into the future.
If you would like to receive more information about this introduction, please feel free to contact me at KyFan1@aol.com.