Good Evening, Lets get right to the point. The emphasis this week is on earnings. Investors will be looking at corporate earnings reports and guidance for two things. First, they will be looking at the numbers to see how they will influence the Fed with regard to further rate increases. Second and equal to that they will be watching to see how healthy the corporations are. They want to know how the companies are holding up in a slowing economy with rising interest rates. They want to see if the reports and/or guidance will give them any insight into whether or not there will be a recession in the US and if so will it be mild or deep. You see, there is a sizeable contingent of investors out there that believe the Fed has already gone to far with their policy of rate increases. They contend that the Fed did not wait long enough to see if their initial increases were effective before enacting new ones. They feel that the Fed has already gone too far. As we have noted in several recent blogs, there are many economists out there that support this train of thought by pointing to the yield curve inversion that has been in place for months now. Personally, I would have to agree with them in that there is a great chance that there will be a recession. I honestly can’t remember when the yield curve inverted and there wasn’t a recession. Also supporting that theory is the fact that in the past when the Fed has increased rates to control inflation it has almost always ended in a recession. All that said, it appears that the economy is holding up exceptionably well as the Fed increases rates. My opinion, for what it is worth, is that there will likely be a mild recession rather than a deep one. We will see. One thing is for sure, the CPI (Consumer Price Index) and PPI (Producer Price Index) as well as the Core Price Index (which strips out food and energy costs) issued last week all indicated that the rate of inflation is slowing. Given those reports, the opinion of investors is evenly split between those that think there will be a +0.25% increase and those that say there will be no increase when the Fed meets in May. One thing most investors do agree on is that the Fed will pause or end their rate increase campaign after that meeting. I am in that camp and when the pause finally occurs I think that will initiate a long recovery process from the pandemic bear market. Of course that depends on nothing else going drastically wrong which is the reason we watch our charts. As usual they and not the news will determine what investment decisions we make. In all honesty, I hardly even looked at the news when I was still working for the government. I didn’t have time. I looked at my charts and made my investments accordingly….. Now there’s some food for thought. Do we actually need to waste our time with news? So why then write about fundamentals?? Because folks want to see why they are seeing what they are seeing on their charts. That and pure technical analysis bores them to tears. I guess there’s just not a lot of people that enjoy statistics……..
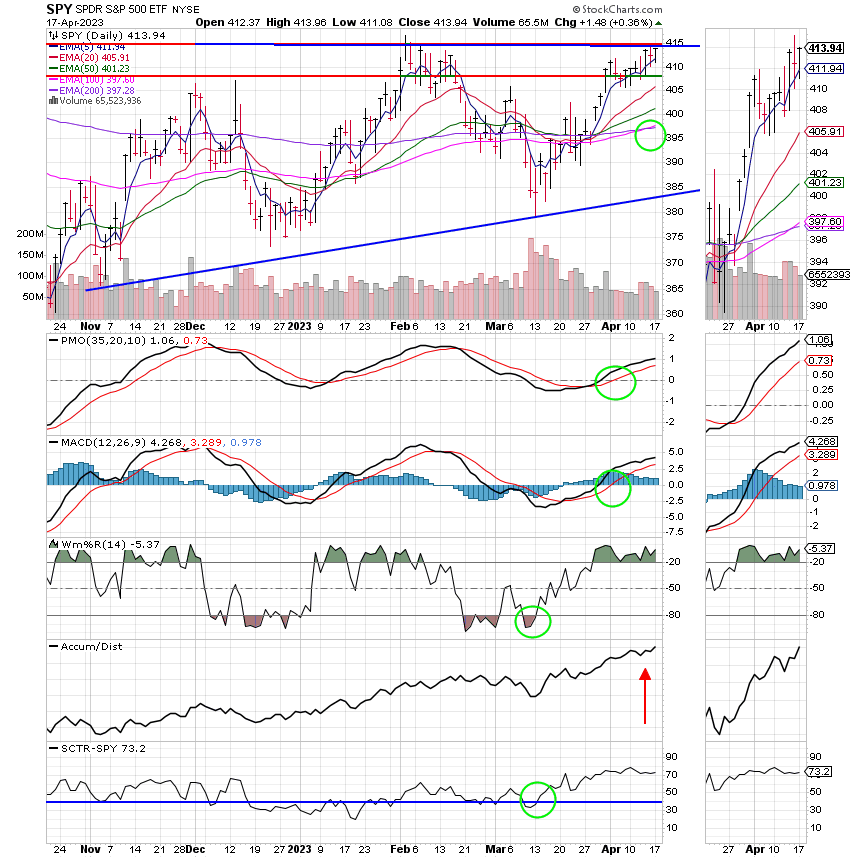
The days trading left us with the following results: Our TSP allotment posted a gain of +0.36%. For comparison, the Dow added added +0.30%, the Nasdaq +0.28%, and the S&P 500 +0.36%. I’ll take it! Praise God for a day in the green.
S&P 500 closes higher Monday to kick off a busy earnings week: Live updates
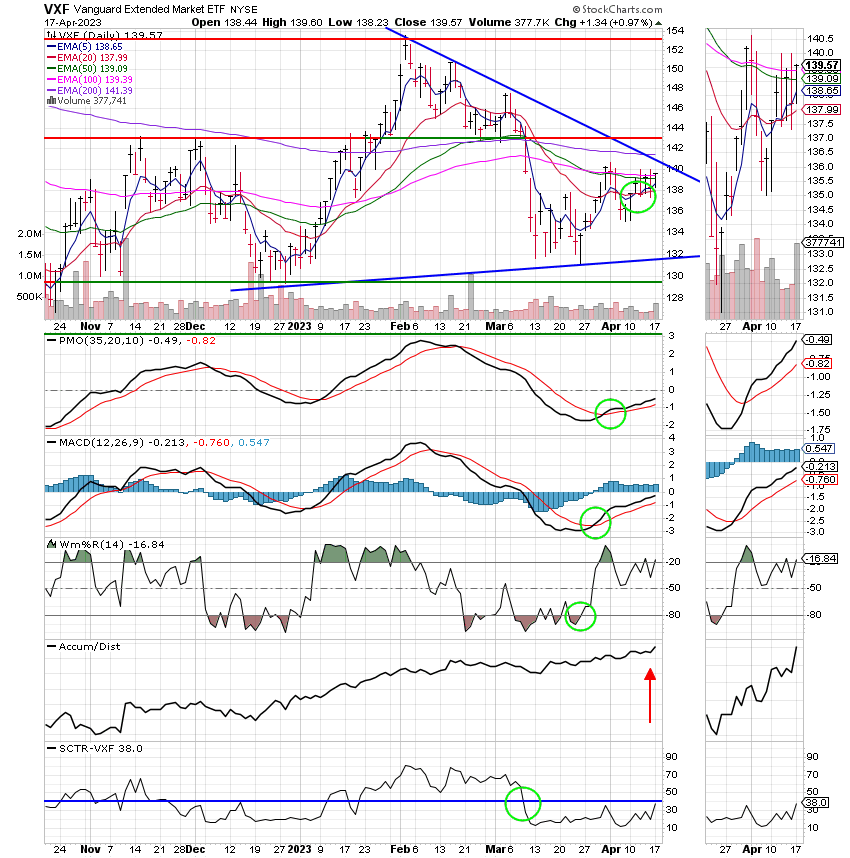
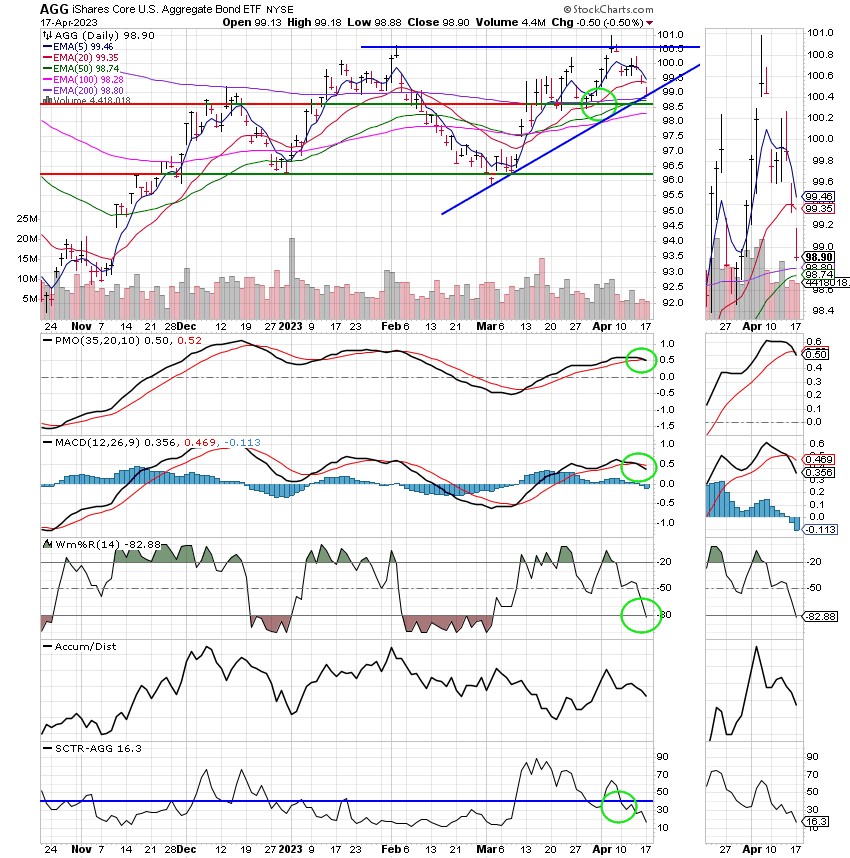
The days action left us with the following signals: C-buy, S-Hold, I-Buy, F-Hold. We are currently invested at 100/C. Our allocation is now -2.40% for the year not including todays results. Here are the latest posted gains:
| 04/14/23 | Prior Prices | ||||
| Fund | G Fund | F Fund | C Fund | S Fund | I Fund |
| Price | 17.4274 | 18.7807 | 63.7909 | 64.2217 | 37.7565 |
| $ Change | 0.0017 | -0.0851 | -0.1334 | -0.4025 | -0.1467 |
| % Change day | +0.01% | -0.45% | -0.21% | -0.62% | -0.39% |
| % Change week | +0.08% | -1.09% | +0.81% | +1.44% | +1.96% |
| % Change month | +0.14% | +0.01% | +0.75% | -1.40% | +2.40% |
| % Change year | +1.12% | +3.15% | +8.30% | +4.37% | +11.24% |
| The Lifecycle (L) Funds | |||||
| Fund | L INC | L 2025 | L 2030 | L 2035 | L 2040 |
| Price | 23.5673 | 11.9048 | 41.3823 | 12.3322 | 46.3333 |
| $ Change | -0.0235 | -0.0172 | -0.0917 | -0.0303 | -0.1237 |
| % Change day | -0.10% | -0.14% | -0.22% | -0.25% | -0.27% |
| % Change week | +0.31% | +0.46% | +0.74% | +0.80% | +0.87% |
| % Change month | +0.36% | +0.48% | +0.68% | +0.73% | +0.78% |
| % Change year | +3.14% | +4.21% | +5.90% | +6.37% | +6.82% |
| Fund | L 2045 | L 2050 | L 2055 | L 2060 | L 2065 |
| Price | 12.6015 | 27.4408 | 13.3383 | 13.337 | 13.3355 |
| $ Change | -0.0361 | -0.0832 | -0.0439 | -0.0440 | -0.0440 |
| % Change day | -0.29% | -0.30% | -0.33% | -0.33% | -0.33% |
| % Change week | +0.93% | +0.99% | +1.29% | +1.29% | +1.29% |
| % Change month | +0.82% | +0.86% | +1.02% | +1.02% | +1.02% |
| % Change year | +7.21% | +7.59% | +8.77% | +8.77% | +8.77% |
Get TSP Fund Returns For Any Date or Between Any 2 Dates


