Good Morning, We spent the first six months of this year retooling our indicators to match the new post pandemic market. Our results suffered. At the end of July we finally had them fully in place. Then it took an additional 2 months to become familiar with how best to read them to unlock as many gains as possible. We have done that. Mission accomplished. Our yearly results won’t reflect it because the market has basically moved sideways with a slightly negative bias since May but we now have an even better read on the market than we did prior to the pandemic and our monthly results from here on out will reflect it. I just had to add that to this blog. It’s exciting how clearly we are seeing the market now. I thank God for His guidance once again. He is a good Father!
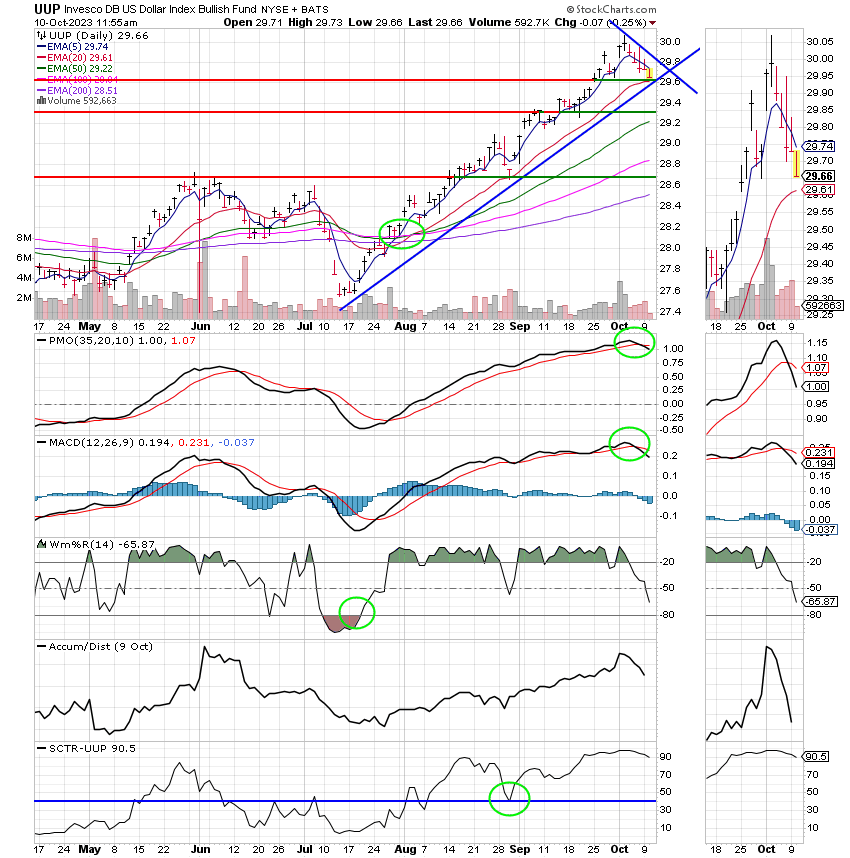
So what are we seeing and where are we at? As you know, there was a tragic attack on Israel this weekend and as a result the futures dropped on Sunday afternoon. A lot of traders pushed the eject button first thing Monday morning only to see the market reverse in the afternoon and leave them holding the bag. Occasionally, those knee jerk reactions turn out to be good but most often not. In the end, this event may end up being the catalyst that finally bottomed this downtrend out. This is most evident by two things. The dollar which is weakening and bond yields that are dropping. As a result stocks are beginning to move higher. As I said in last weeks blog this market is extremely extended and oversold. It has been in a bottoming process and waiting for an excuse to start moving up again. As ironic as it may seem, this may well be it. Our indicators never wavered. Initially, we decided to hold through the current down trend as we projected a dip somewhere in the 5-6% range. That is exactly what we got. Now we are beginning to recover some of the ground we lost in the sell off. It’s hard to tell, but it looks like this run could deliver us 6-7% and bring us back into the green for the year yet again (Hopefully to stay this time). I am not the only analyst who sees it this way. Check this out. I posted it on our Facebook page earlier.
Good chance stock market lows are in, Fundstrat says
Fundstrat technical strategist Mark Newton noted that the lows in the S&P 500 are likely in at this point.
“US Equity markets look to be bottoming in the historic ‘bear-market killer’ month of October following oversold conditions during a time of seasonal tailwinds and bearish sentiment,” Newton wrote overnight. “The effect of the attack on Israel resulting in yields rolling over looks important and Equities are responding to this more than the perceived Israeli retaliation.”
“While some might see this as ‘jumping the gun,’ I do feel like there’s a good likelihood that Equity market lows could be in place after the constructive bounce in recent days,” he added.
— Fred Imbert
Good for you Mark! I fully concur.
Now all that noted what is our plan? Will this market head straight up? I don’t think that is likely. We still have the elephant in the room that is inflation. I know I say it every week, but the volatility will continue until the rate of inflation reaches the Fed preferred two percent. So what that means for us that we will see another sell signal at the end of this run. When that occurs we will have to be disciplined and protect our gains until the next run. It doesn’t do you any good to see the market clearly if you fail to ever take action on it. Discipline wins the day!
OK Sean, here’s a couple charts for you….. the First is the 10 year bond yield and the second is the dollar..
Oh yeah! That’s a change…..
The days trading has so far generated the following results: Our TSP allotment is currently in the green by +1.09%. For comparison, the Dow is up +0.77%, the Nasdaq +1.21%, and the S&P 500 +1.09%. Thank you Jesus!
Stocks rise Tuesday as Treasury yields drop
The most recent action has left us with the following signals: C-Hold, S-Hold, I-Hold, F-Hold. We are currently invested at 100/C. Our allocation is now -5.87% on the year not including the days results. Our allocation is +0.52% for the month. Here are the latest posted results:
| 10/06/23 | Prior Prices | ||||
| Fund | G Fund | F Fund | C Fund | S Fund | I Fund |
| Price | 17.7624 | 17.8067 | 66.9353 | 65.9699 | 35.9926 |
| $ Change | 0.0023 | -0.0661 | 0.7922 | 0.8302 | 0.3657 |
| % Change day | +0.01% | -0.37% | +1.20% | +1.27% | +1.03% |
| % Change week | +0.08% | -1.17% | +0.52% | -1.49% | -0.84% |
| % Change month | +0.08% | -1.17% | +0.52% | -1.49% | -0.84% |
| % Change year | +3.06% | -2.20% | +13.63% | +7.22% | +6.04% |


