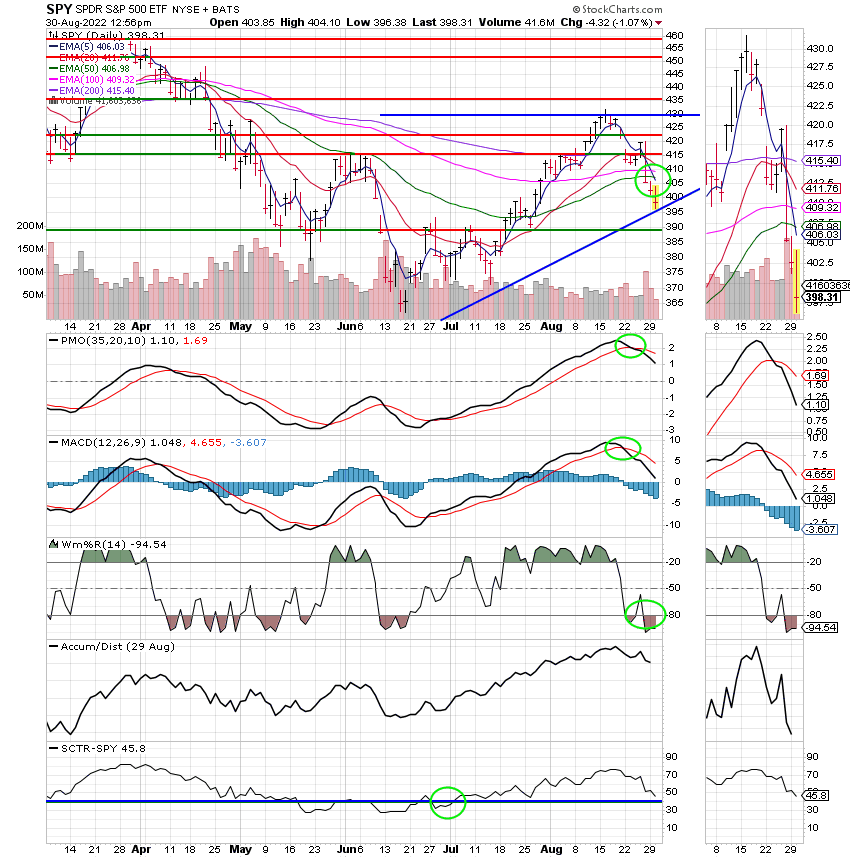
Good Day, Nothing has really changed this week. Perhaps investor perception has changed which would account for the wild swings in stock prices that continue to occur, but I won’t opine further on that at this time. The perception of current news by market players is most if not all of what determines how the market trades….. The important thing as always is to realize what is occurring. Why is nice but what is essential! What is happening now is that the market has settled into a wide trading range that ranges from the lows of June and July to the highs recently set in August. That range is from about 3620 to 4320 for the S&P 500 amounting to a swing of close to 16.2%. As far as trading ranges go that’s a pretty big one. In order to stay invested right now you have to be willing to watch your account vary by that amount and that’s really tough to do. Nevertheless, that’s the rules of the game right now. Also, complicating this difficult trading is the fact that the computer algorithm traders which make their money off the market movement have focused in on this volatility and are taking maximum advantage of emotional investors. You see they move large sums of money very fast and can move stocks a few percentage points in the direction they want them to go and then abruptly change course leaving those emotional unsuspecting investors in their wake. Most notably, they changed tactics recently to focus on key technical levels in the charts as they know that many investors now utilize technical analysis to execute their trading decisions. There strategy is simple. They move the stocks just far enough to breach a key technical level on the chart such as the 50 day moving average in order to entice investors to buy or sell and then reverse course at those investors expense. I would be less than honest with you if I did not say that this very thing happened to us not once but twice this year. This had never been the case before, but they changed their tactics so we had to change ours as well. We simply went to our indicators with a longer time duration and ignored the short stuff in order to overcome the fake out before the breakout. Adapt, improvise, and overcome……that’s what we did and continue to do….. bet you can’t guess what branch of the service I was in??? Anyway, current support sits at around 3931 for the SPX. Price is already trading below the 200, 100, 50, and 20 EMA’s (Exponential Moving Averages) which has generated a sell signal. We are currently watching to see if the support at 3931 holds. If it does not then prices are likely heading for a test of June/July bottom of 3621.70 which would represent a gap lower of about 7.8%. If that happens we will have to decide whether or not we want to sell (short the market) and try to buy back in closer to the 3600 level and perhaps pick up a percentage point or two in doing so. Honestly, I prefer about a 10% range before I attempt this strategy. So 7.8% is a tight window. Really, the whole thing depends on how confident we are of the low at 3621. As a general rule we sell without question when support is broken and consider it as an insurance policy if it doesn’t work out. Well, we payed the insurance and didn’t collect on any claims twice already this year. To be on the safe side we’ll probably sell again if the 3945.80 level is broken which could easily happen before the trading day ends. We will see…… As of right now price for the SPY which is the ETF for the S&P 500 sits at 397.51 and support is at 394.58. That’s close. Right in that sweet area that the algorithms reversed earlier this year. We’ll just have to look at every indicator we have and see if they support selling or holding. Right now I can tell you that they support selling, but that can always change. So again, we will just have to see how it plays out. Anyway, that’s the plan. It’s a game of chicken between us and the algorithm traders. Wonder who will blink first this time…… Keep praying that God will guide our hand!!
The days trading is generating the following results: Our TSP allotment is in the red at -1.30%. For comparison, the Dow is off -1.11%, the Nasdaq -1.52%, and the S&P 500 1.32%.
Stocks drop for a third day on worries central banks will keep raising rates, Dow sheds 300 points
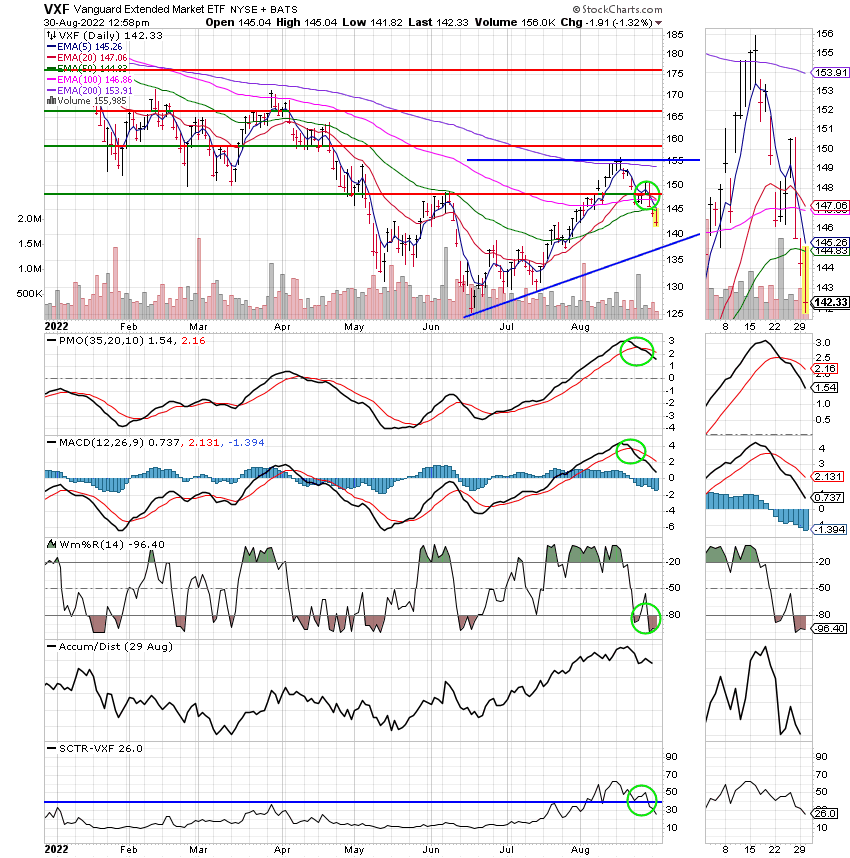
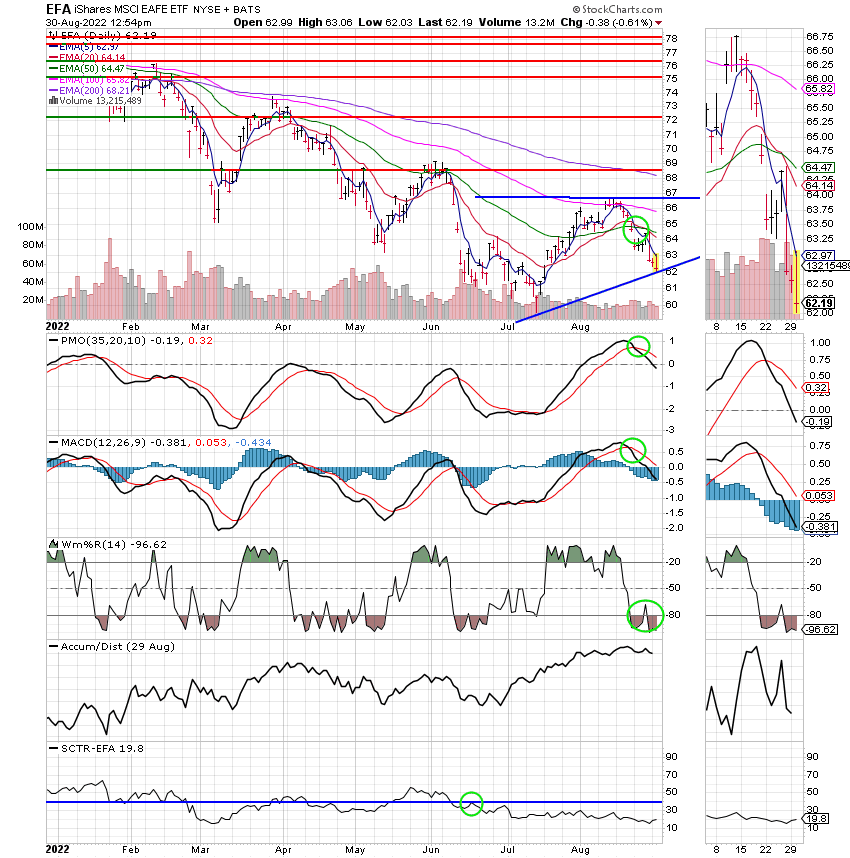
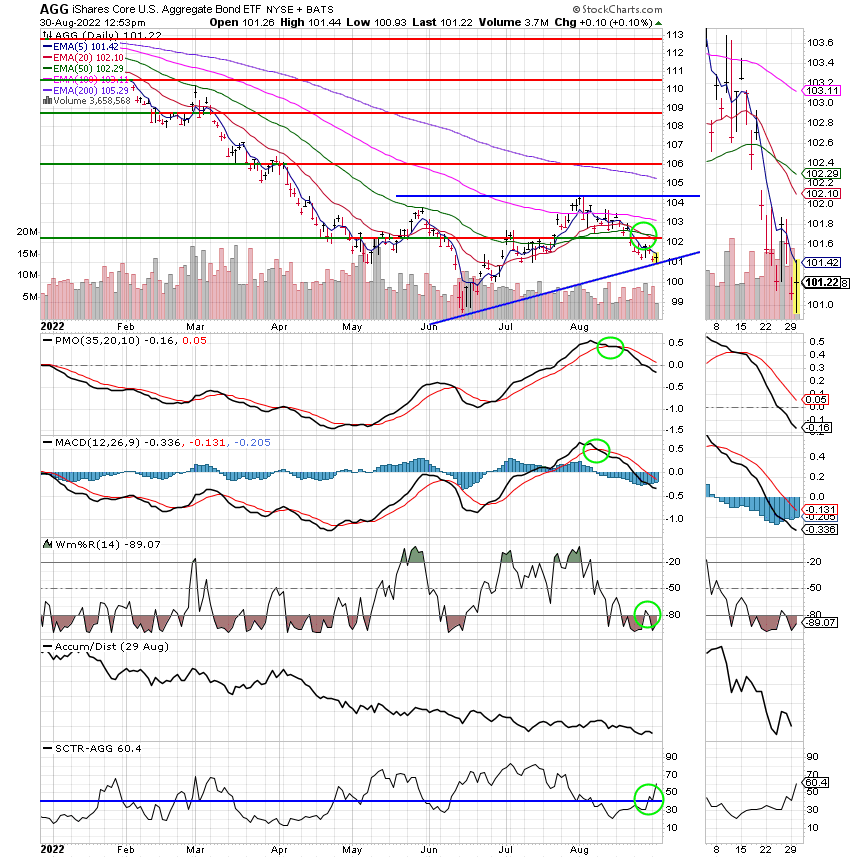
The days action has left us with the following signals: C-Sell, S-Sell, I-Sell, F-Sell. We are currently invested at 100/C. Our allocation is now -26.63% for the year not including the days results. Here are the latest posted results.
| 08/29/22 | Prior Prices | ||||
| Fund | G Fund | F Fund | C Fund | S Fund | I Fund |
| Price | 17.0119 | 18.7771 | 61.4668 | 66.1821 | 32.0533 |
| $ Change | 0.0040 | -0.0824 | -0.4100 | -0.6172 | -0.1104 |
| % Change day | +0.02% | -0.44% | -0.66% | -0.92% | -0.34% |
| % Change week | +0.02% | -0.44% | -0.66% | -0.92% | -0.34% |
| % Change month | +0.23% | -2.43% | -2.28% | -0.26% | -4.65% |
| % Change year | +1.65% | -10.10% | -14.57% | -20.68% | -18.73% |
Now lets take a look at the charts. All signals are annotated with green circles. If you click on the charts they will become larger. If you want to learn more about technical analysis check out the website StockCharts.com.
C Fund:

S Fund:

I Fund:

F Fund:

Never forget that things can change quickly in this market. Be wary of reversals and consult all your charts carefully before you make any moves. Being in the market currently is about being positioned for the next run whenever that comes. If you feel you are in the best position you can be in then you should hold. If you feel you can improve that position then sell and try to buy back in at a lower price. The volatility will decrease as the rate of inflation decreases. If you don’t know anything else that’s really all you have to watch. As I have noted 100 times. The rate of inflation that the Fed is looking for is 2%. They will continue to increase rates until that level is reached and the market will continue to react to those increases which is what causes the volatility. We said here that it would be that way before it started and so far it has done just as we thought. Right now it’s totally a matter of getting positioned and staying the course. Of course it also goes without saying. Keep praying!! That’s all for today. Have a nice afternoon and may God continue to bless your trades!
God bless, Scott ![]()
***Just a reminder that you can review the performance of our allocation at the Web Site TSPTALK.com in the autotracker section under the screen name KyFan1.
I produce and publish this blog as both a ministry and for the benefit of any Federal Government Employee. This is done to offer you some guidance as to how to approach your retirement more financially successful. When it is time for you to retire, I recommend you utilize the services of a Professional Money Manager, who works with a reputable investment firm. He understands the guidance you have already received and he can manage your savings assets utilizing a more advanced investment program into the future. If you would like to receive more information about this introduction, please feel free to contact me at KyFan1@aol.com.
