Good Evening,
Did I get that date right??? OK, I had to check as I usually miss it a time or two when the new year starts! Gosh, did I say that I was glad that 2014 is over? Today is technically the new year, but the new year in trading really starts on Monday. Today was a low volume day that included a lot of tax selling and portfolio adjustment on low volume that was easily pushed around by the machines. So the bottom line is that you can’t take much from today’s action. The true trading will start when all the market players return from the holiday. We were actually in the right place today at 100/G. The G Penny again beat everything but the F Fund, which made another solid gain. Our AMP allocation bested the big three again with a small gain of +0.061%. In comparison, the Dow rose +0.06%, the S&P 500 dropped -0.03%, and the Nasdaq fell back -0.20%.
Euro and oil resume fall; stocks slip on weak data
| 01/01/15 | |||||
| Fund | G Fund | F Fund | C Fund | S Fund | I Fund |
| Price | 14.6165 | 16.8017 | 27.1655 | 36.2964 | 24.2183 |
| $ Change | 0.0000 | 0.0000 | 0.0000 | 0.0000 | 0.0000 |
| % Change day | +0.00% | +0.00% | +0.00% | +0.00% | +0.00% |
| % Change week | +0.00% | +0.00% | +0.00% | +0.00% | +0.00% |
| % Change month | +0.00% | +0.00% | +0.00% | +0.00% | +0.00% |
| % Change year | +0.00% | +0.00% | +0.00% | +0.00% | +0.00% |
| L INC | L 2020 | L 2030 | L 2040 | L 2050 | |
| Price | 17.4508 | 22.8987 | 24.8062 | 26.379 | 14.9586 |
| $ Change | 0.0000 | 0.0000 | 0.0000 | 0.0000 | 0.0000 |
| % Change day | +0.00% | +0.00% | +0.00% | +0.00% | +0.00% |
| % Change week | +0.00% | +0.00% | +0.00% | +0.00% | +0.00% |
| % Change month | +0.00% | +0.00% | +0.00% | +0.00% | +0.00% |
| % Change year | +0.00% | +0.00% | +0.00% | +0.00% | +0.00% |
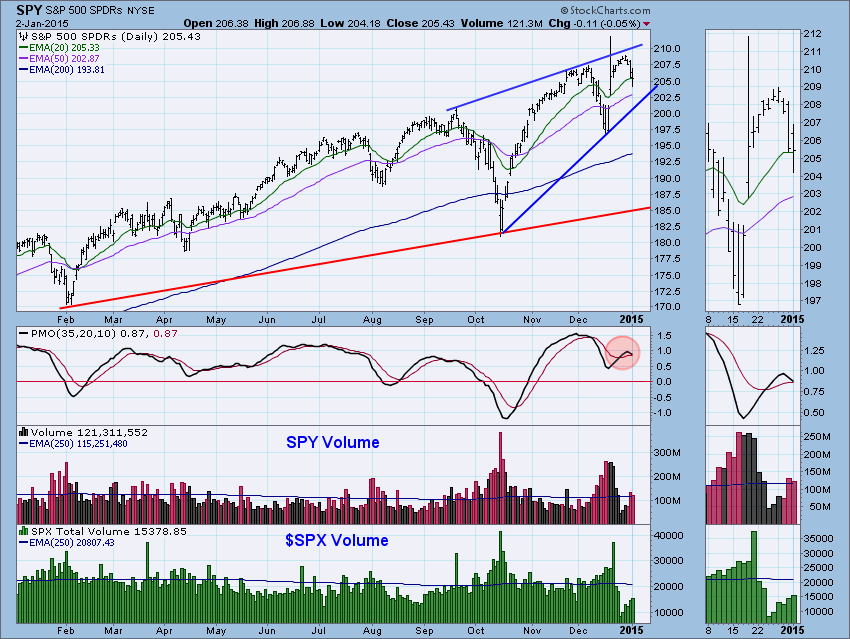
Here’s what the SPY looked like today. (Chart and analysis courtesy of stockcharts.com)
Price has pulled back since hitting overhead resistance. Based on the nearing PMO SELL signal and bearish ascending wedge, I suspect this will become more of a correction than pullback. Volume on the $SPX has been slowly rising during the recent price decline which is also bearish.